3. Exploratory data analysis methods
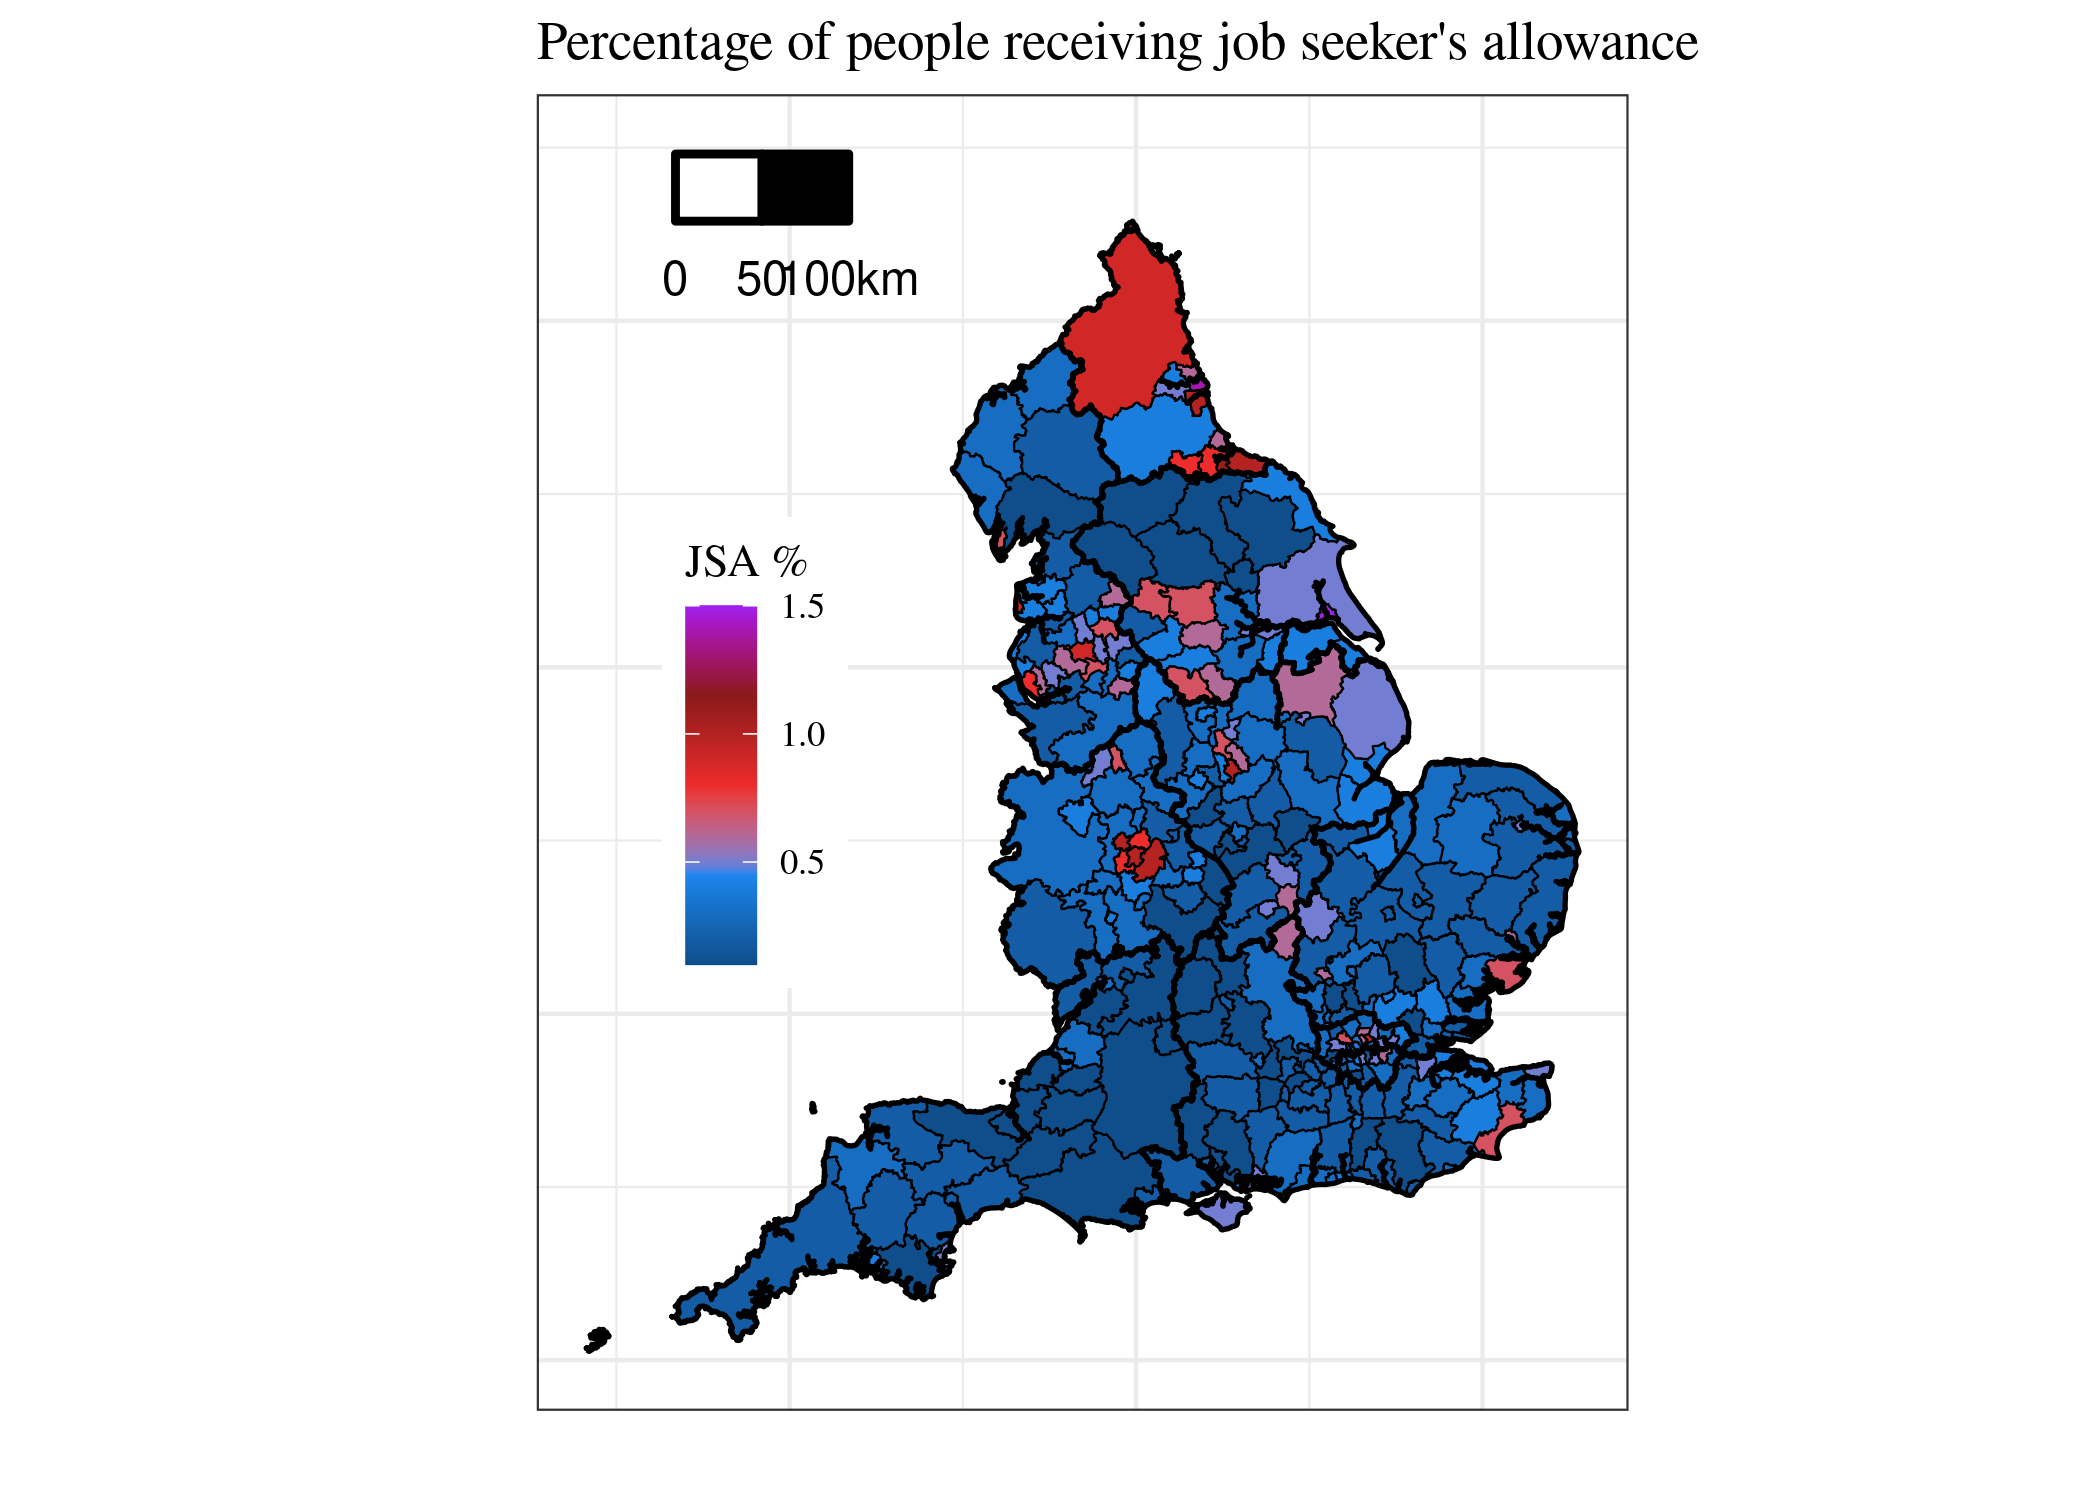
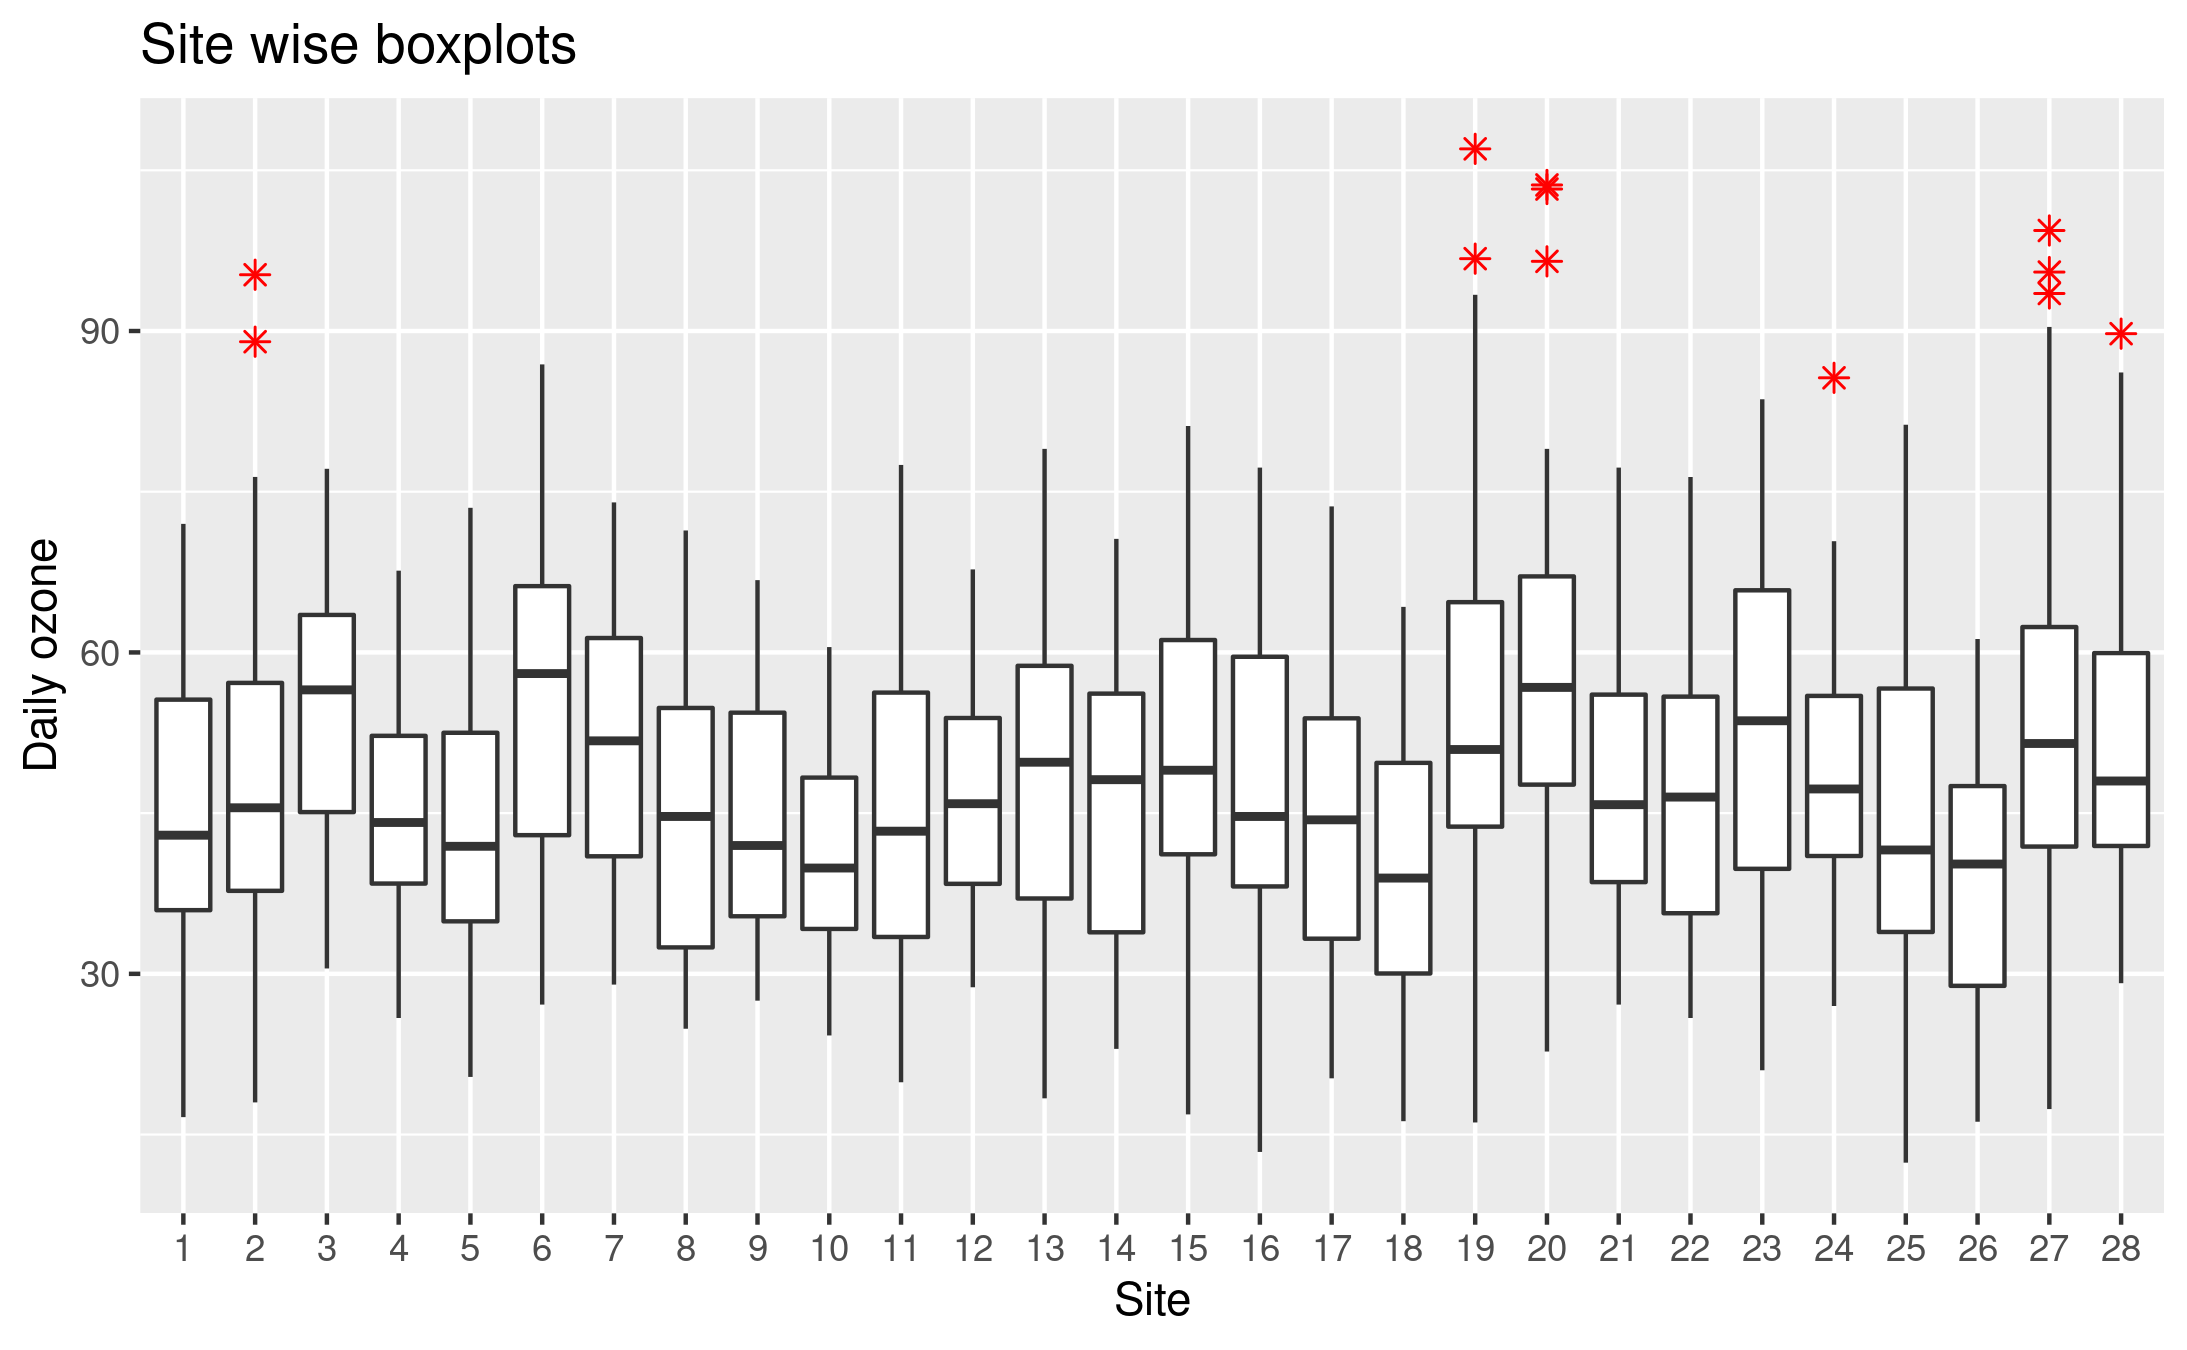
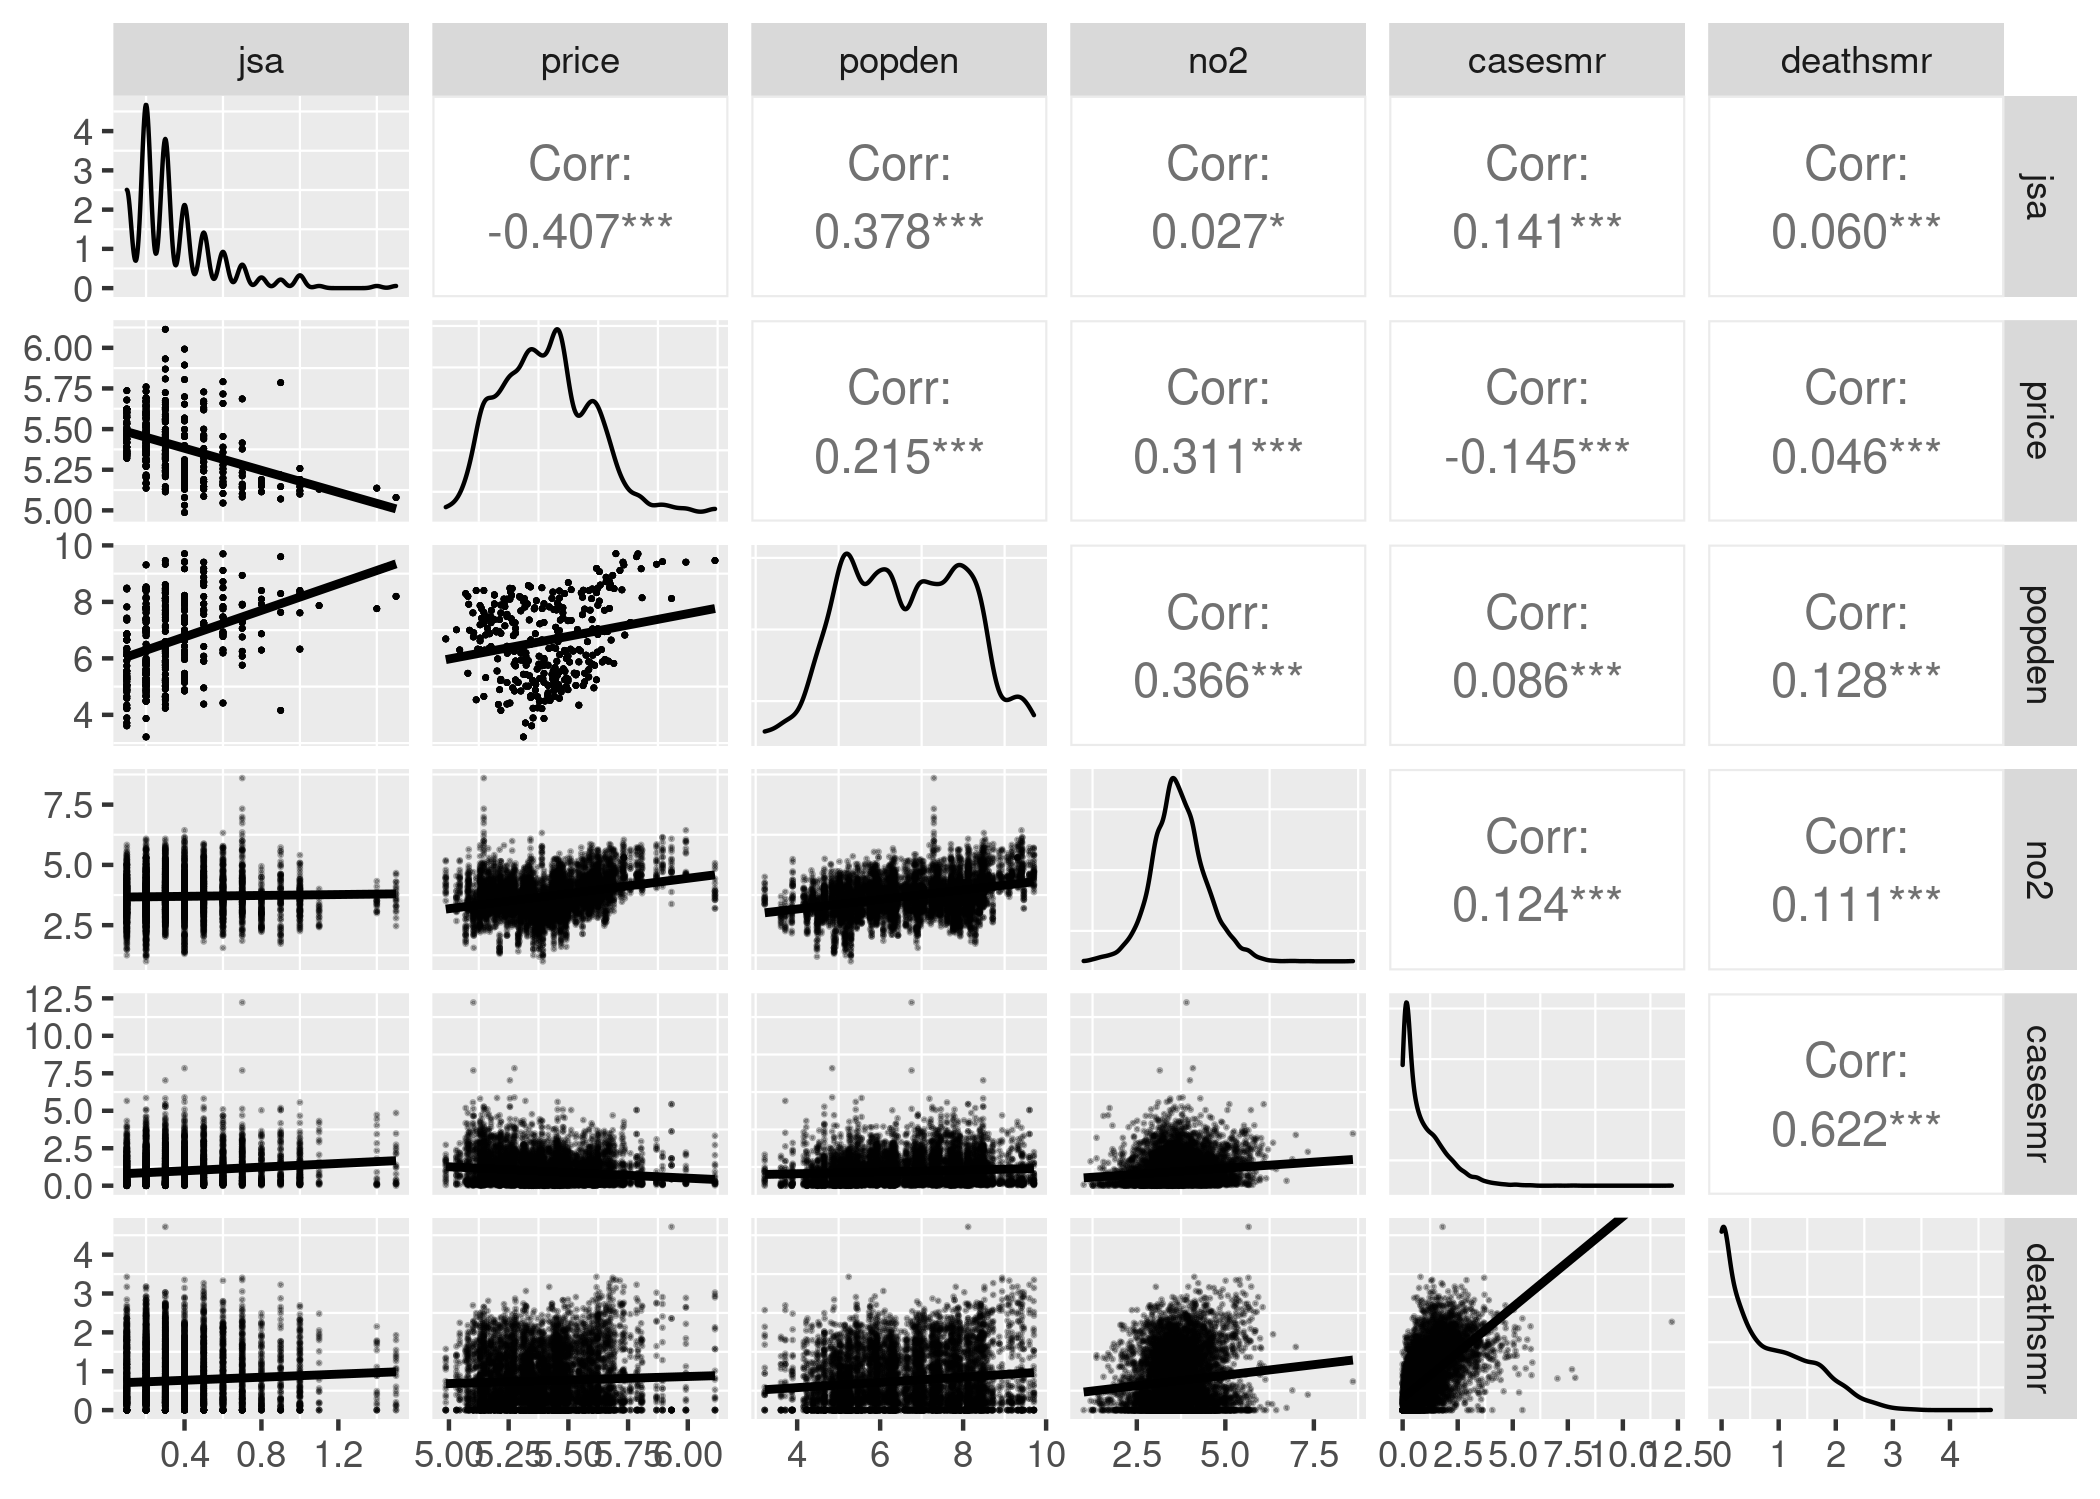
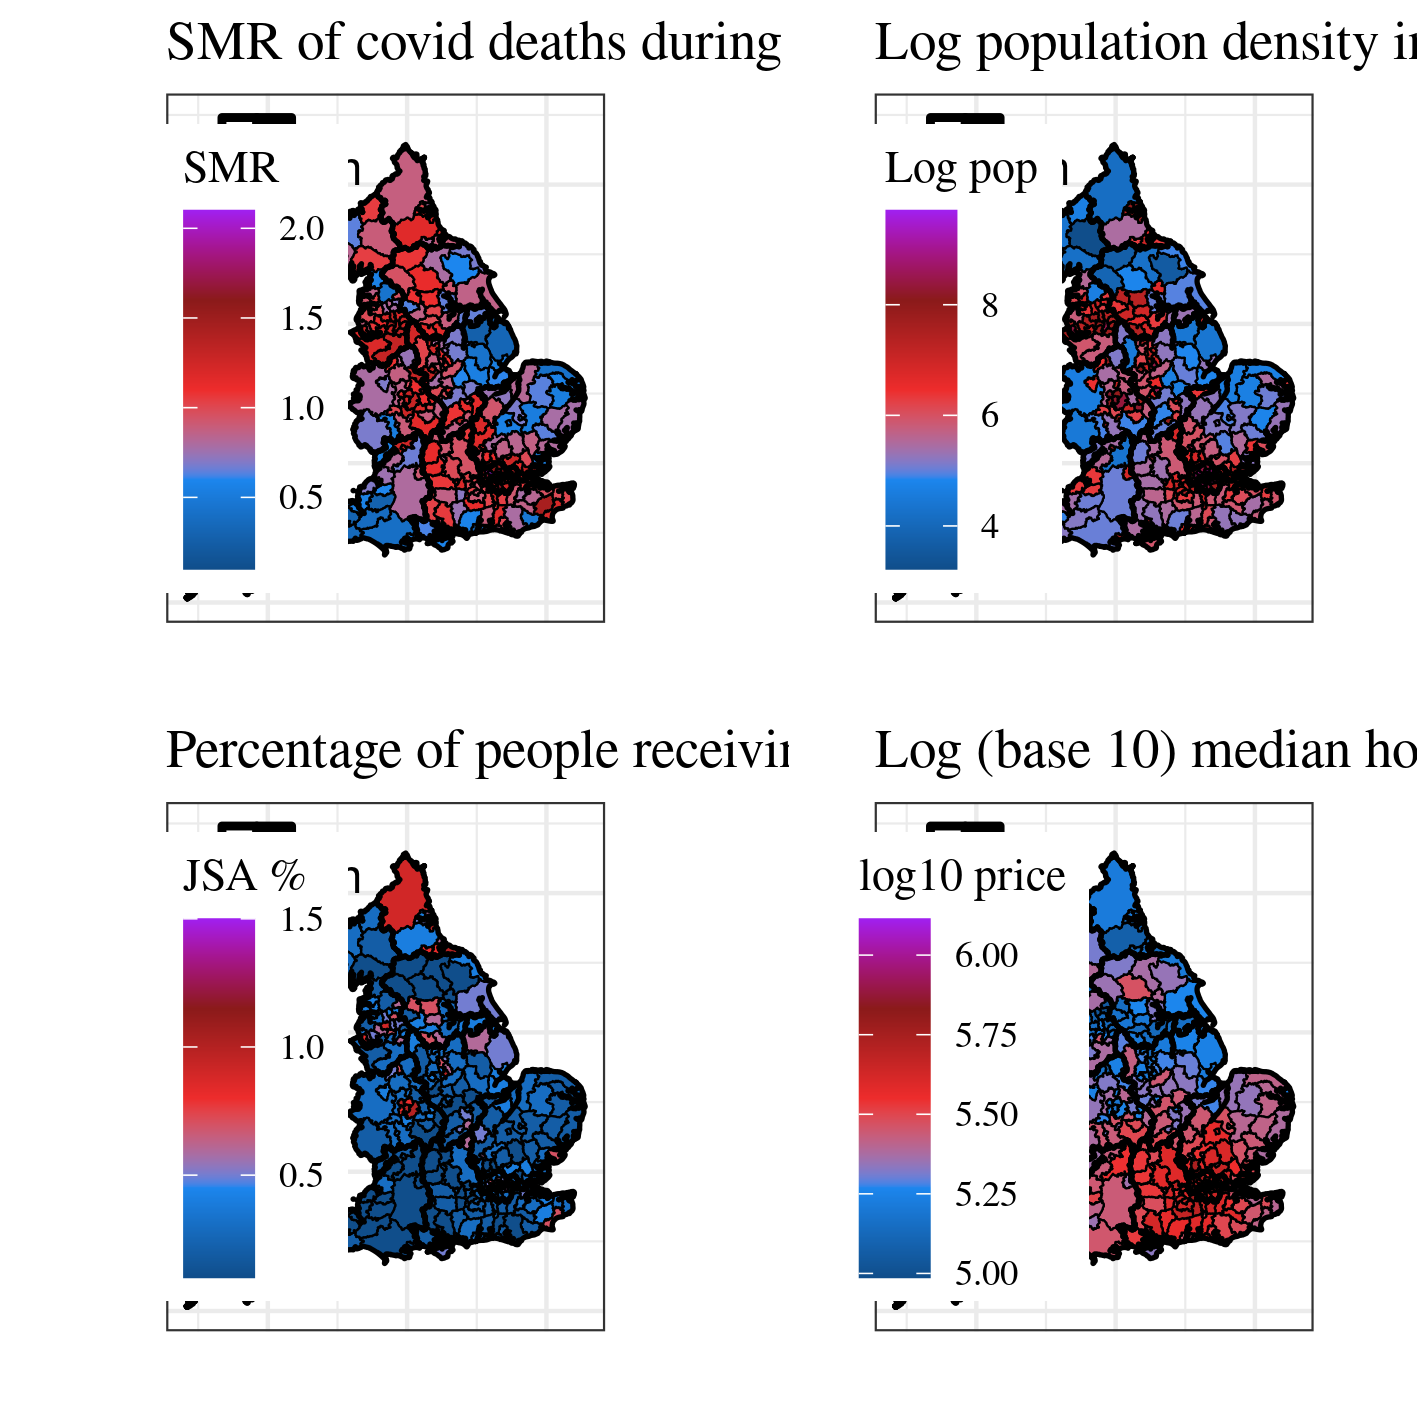
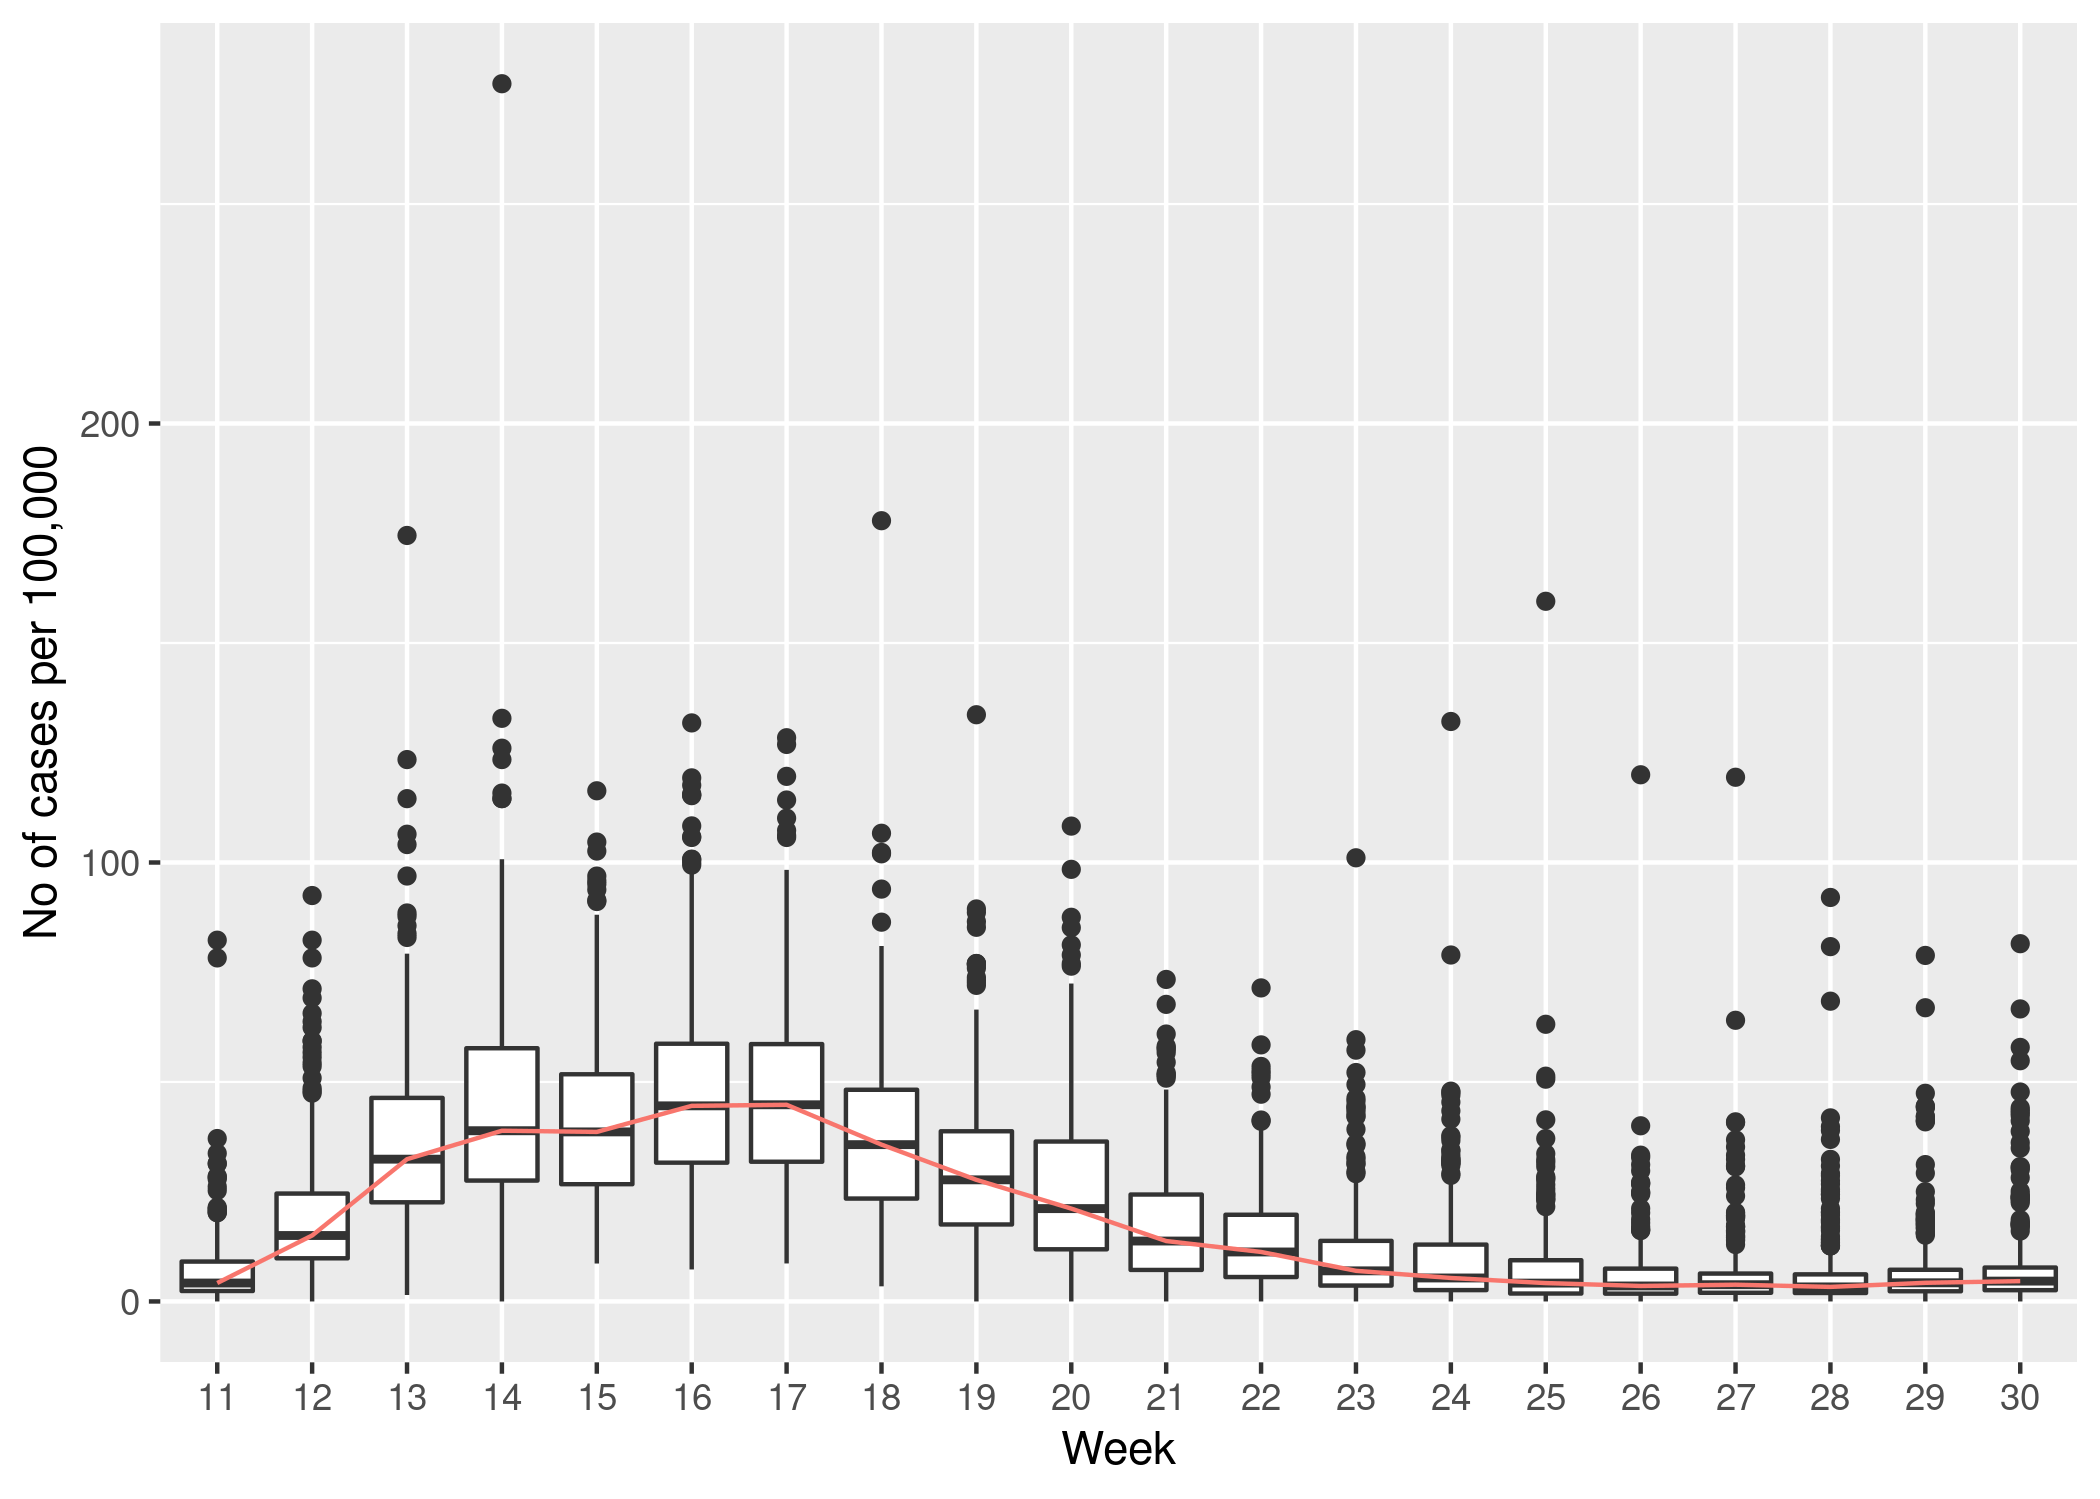
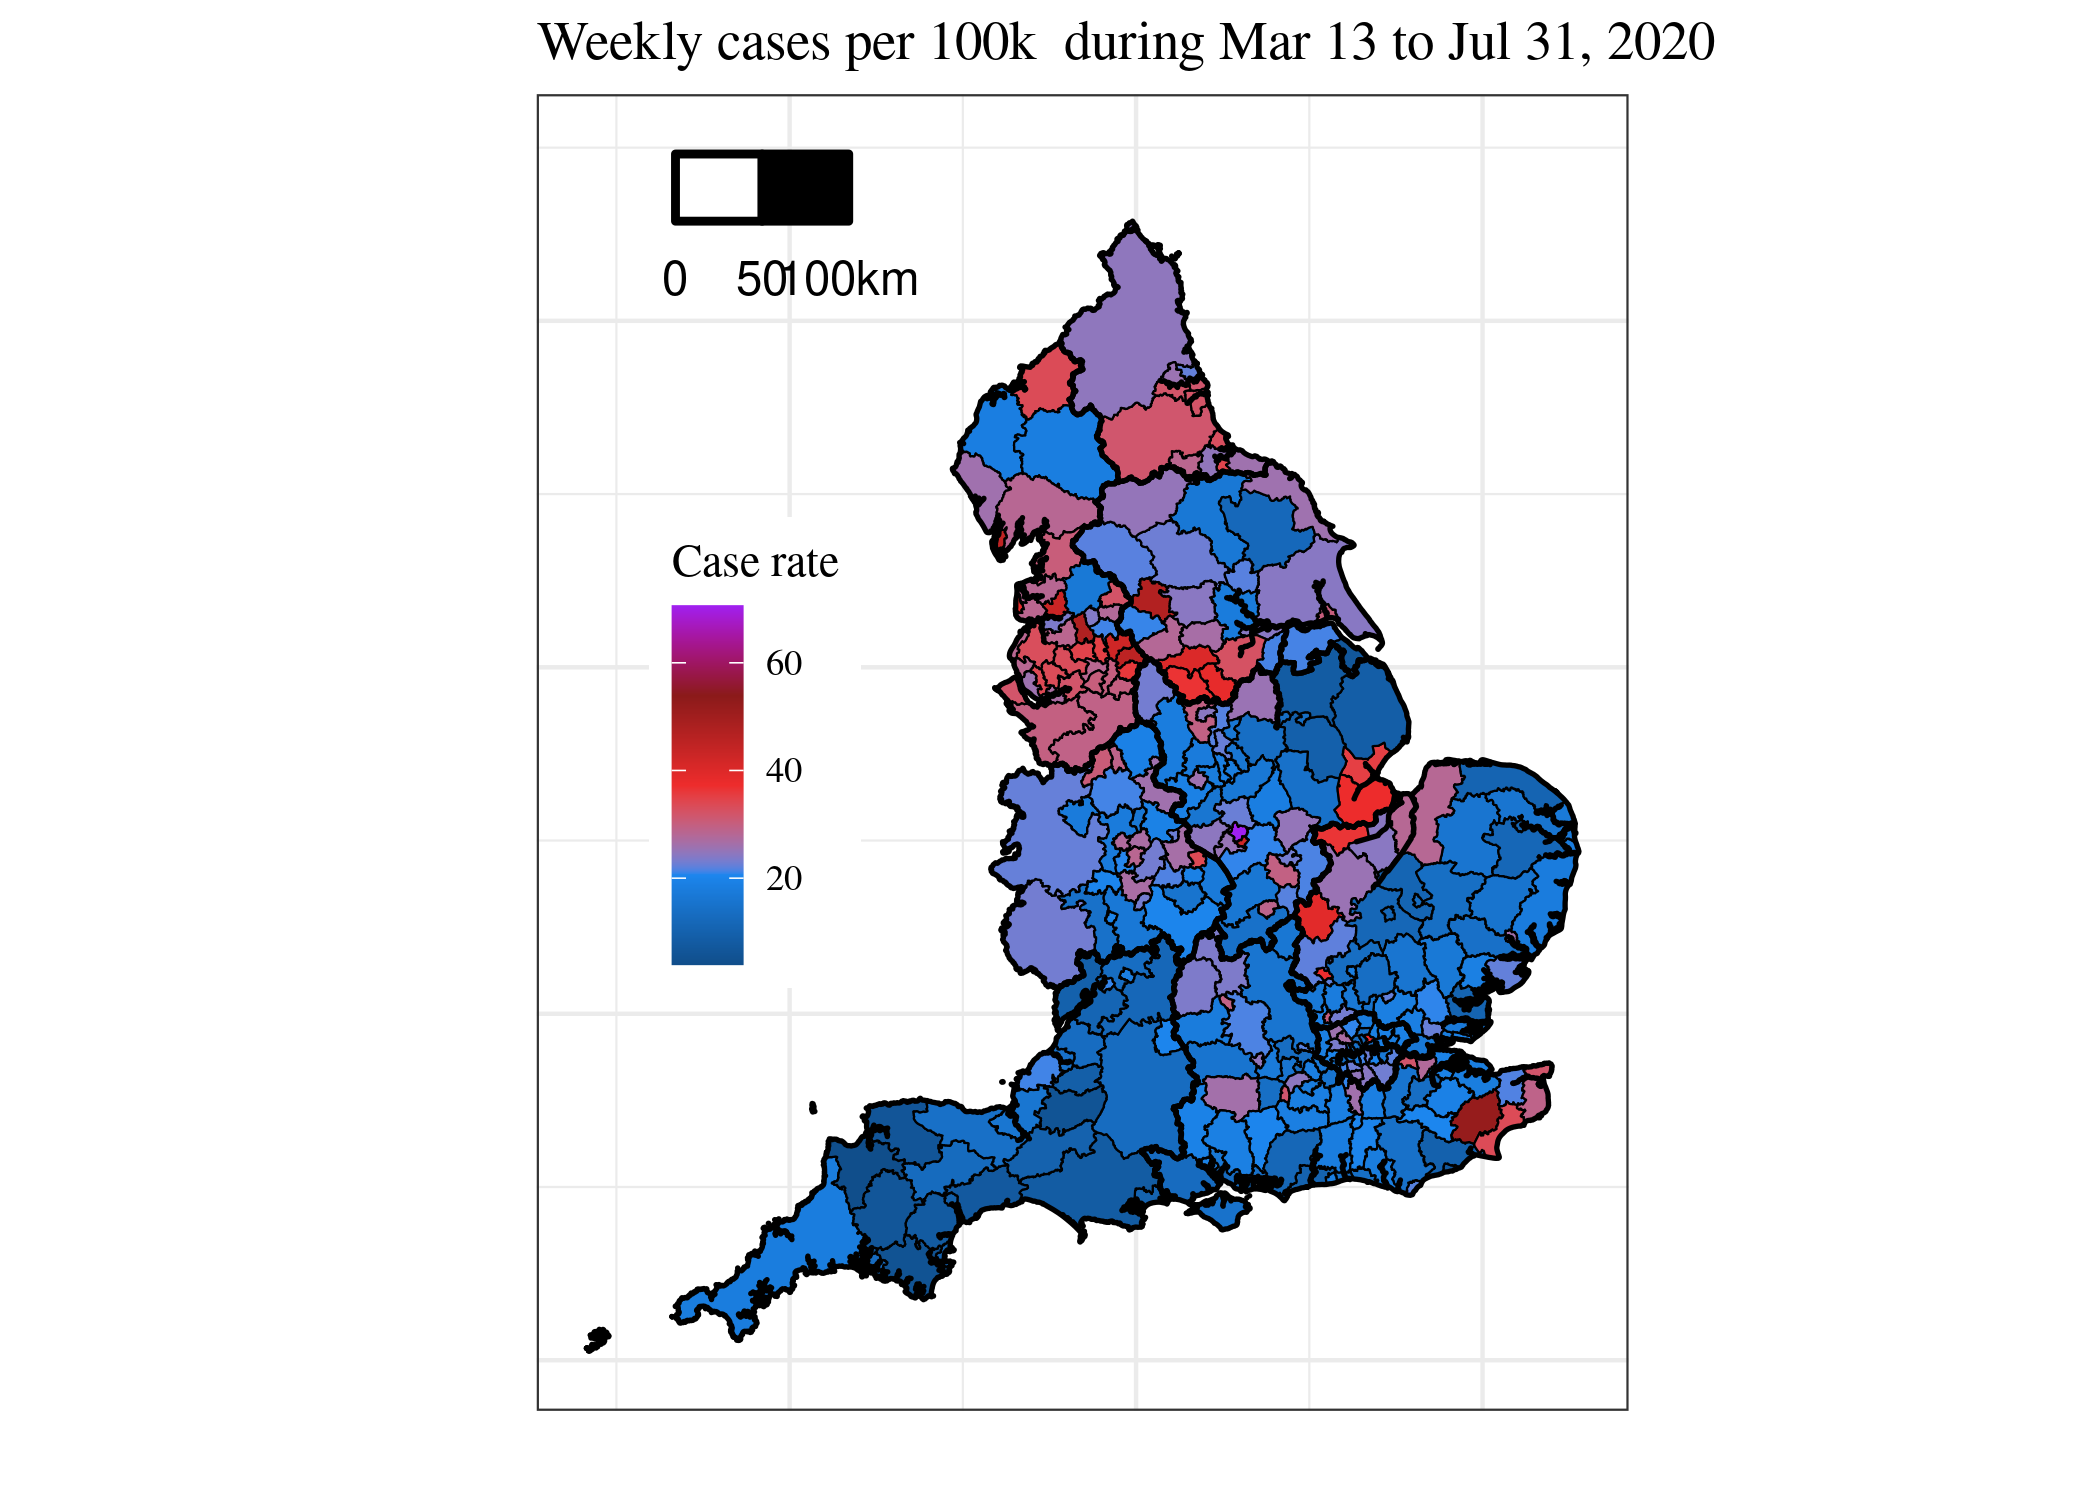
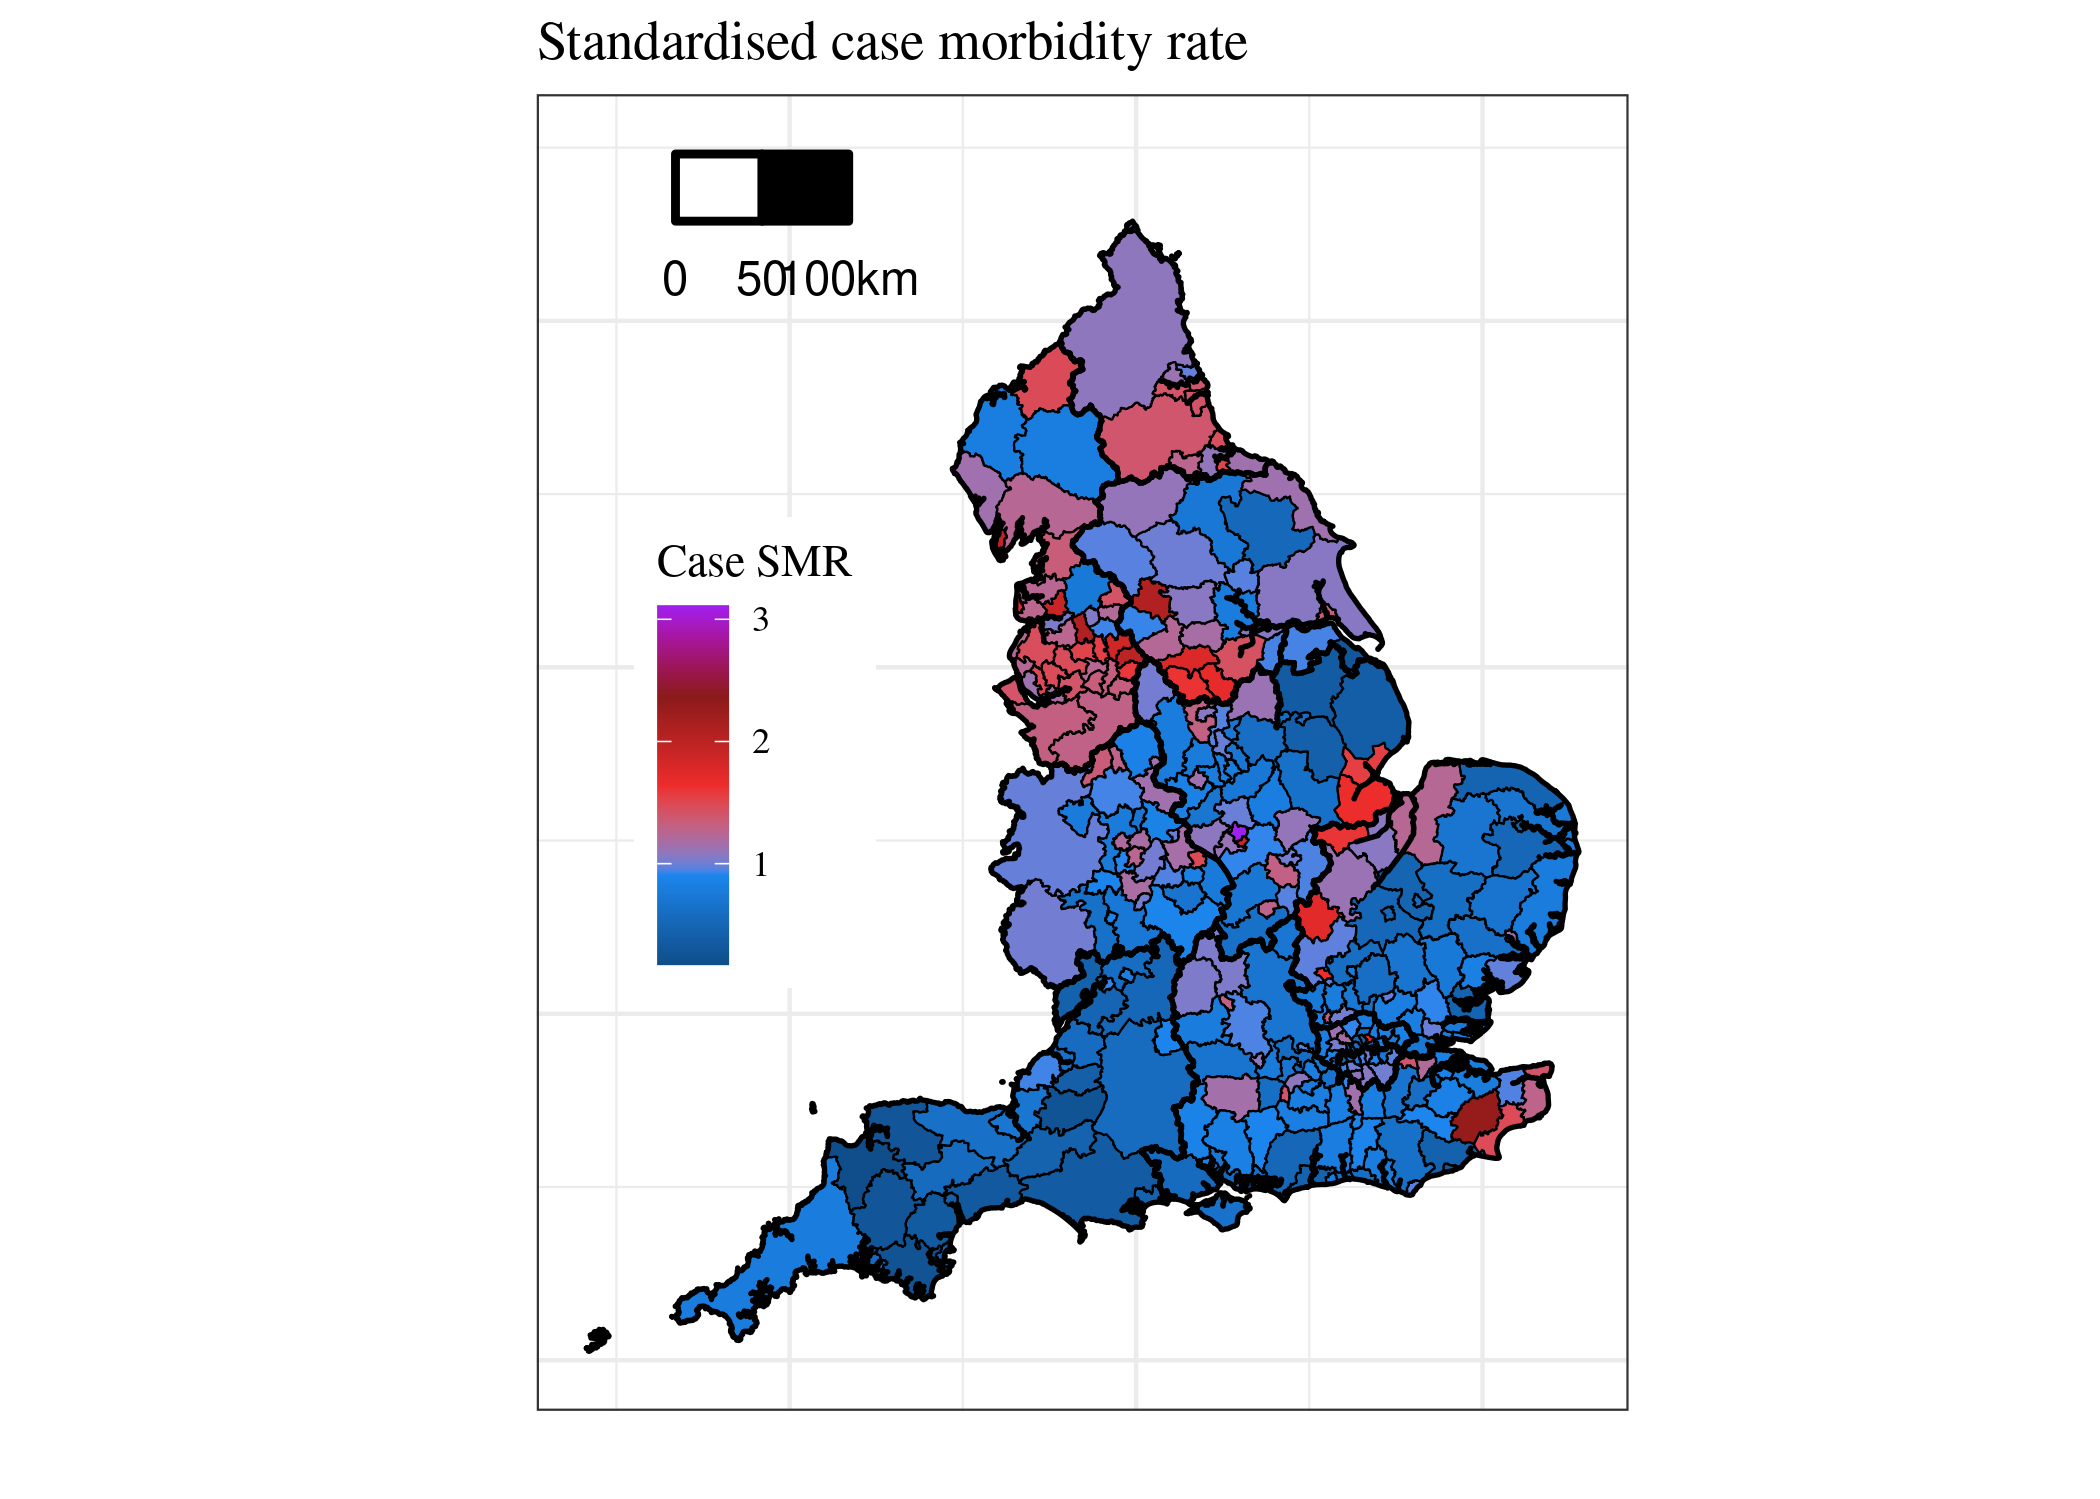
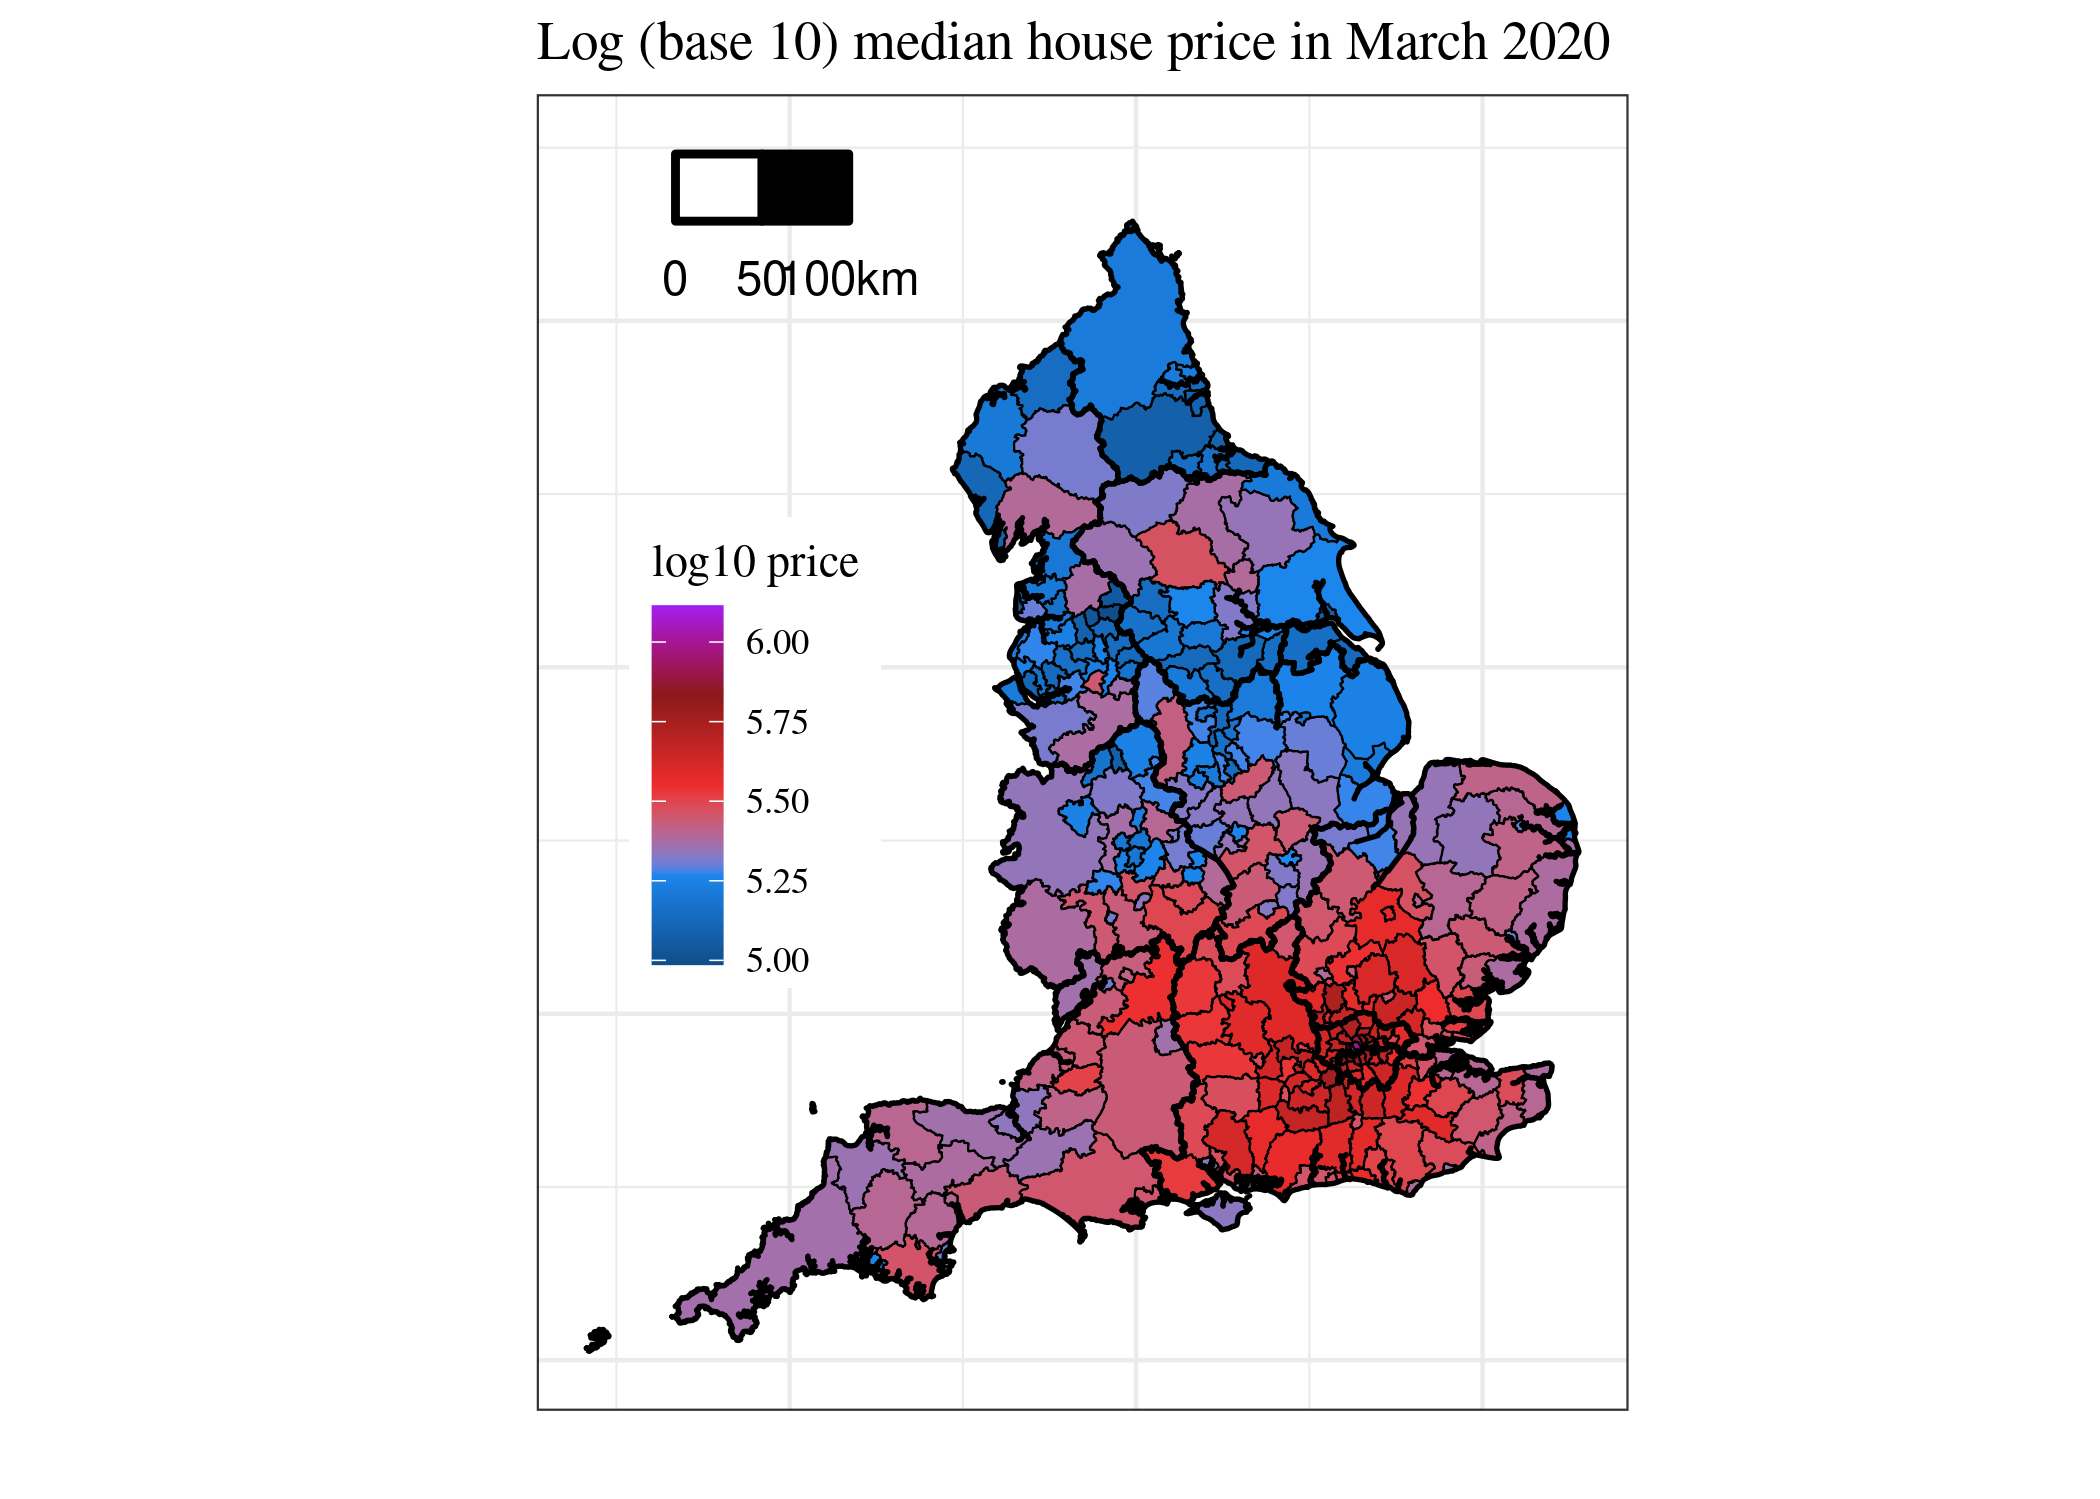
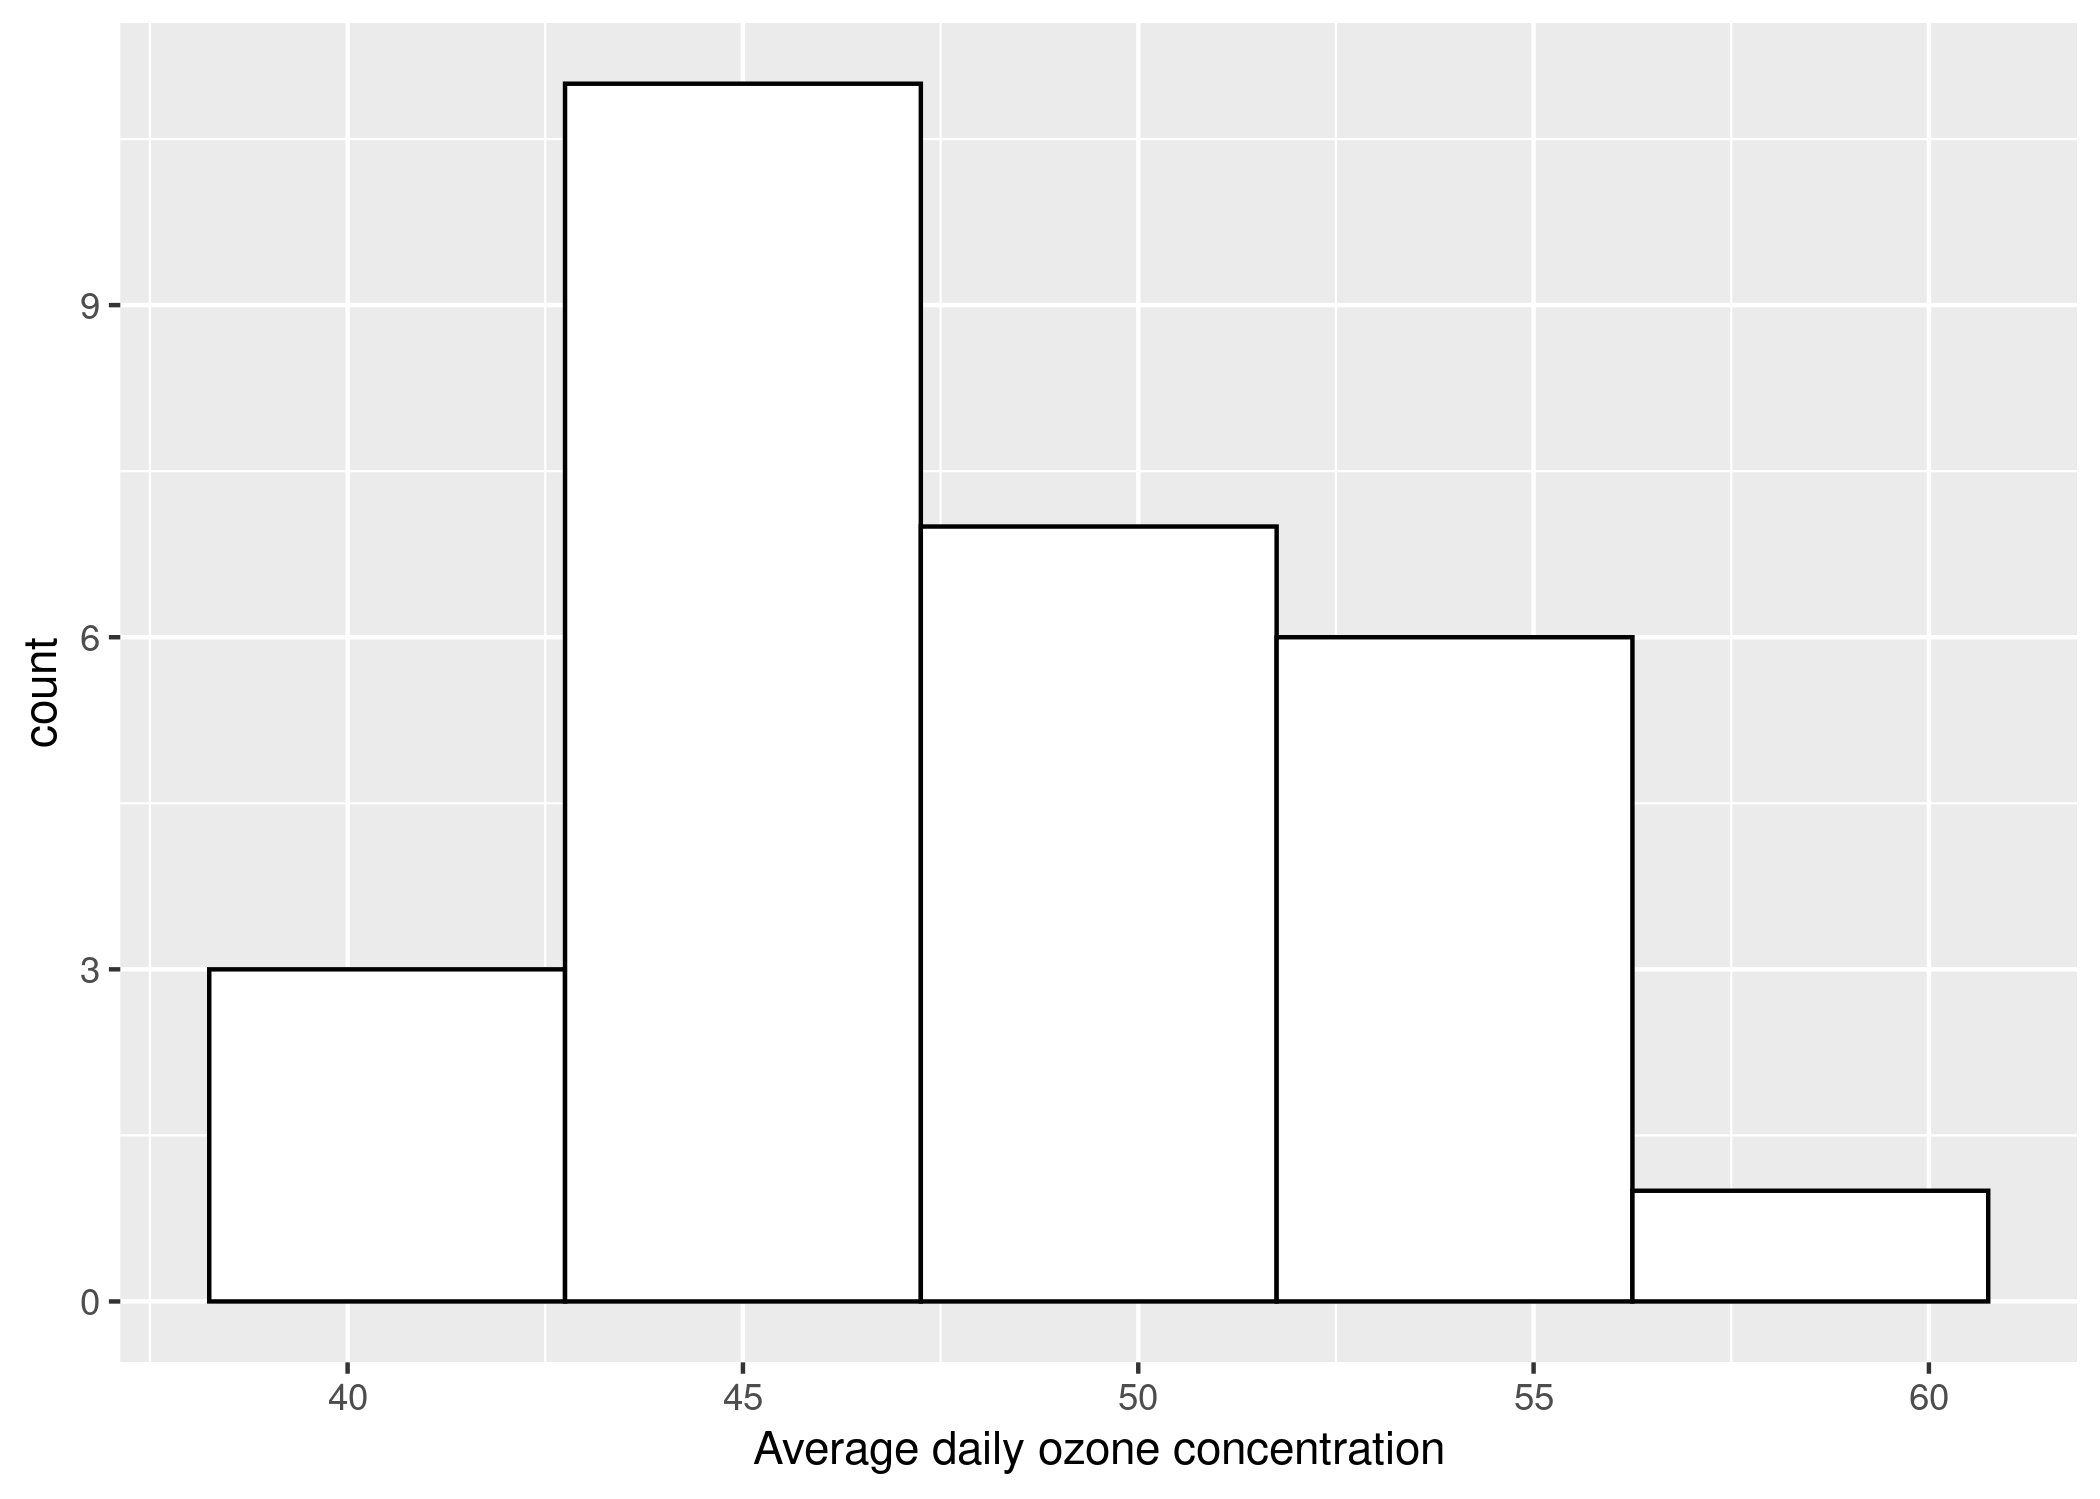
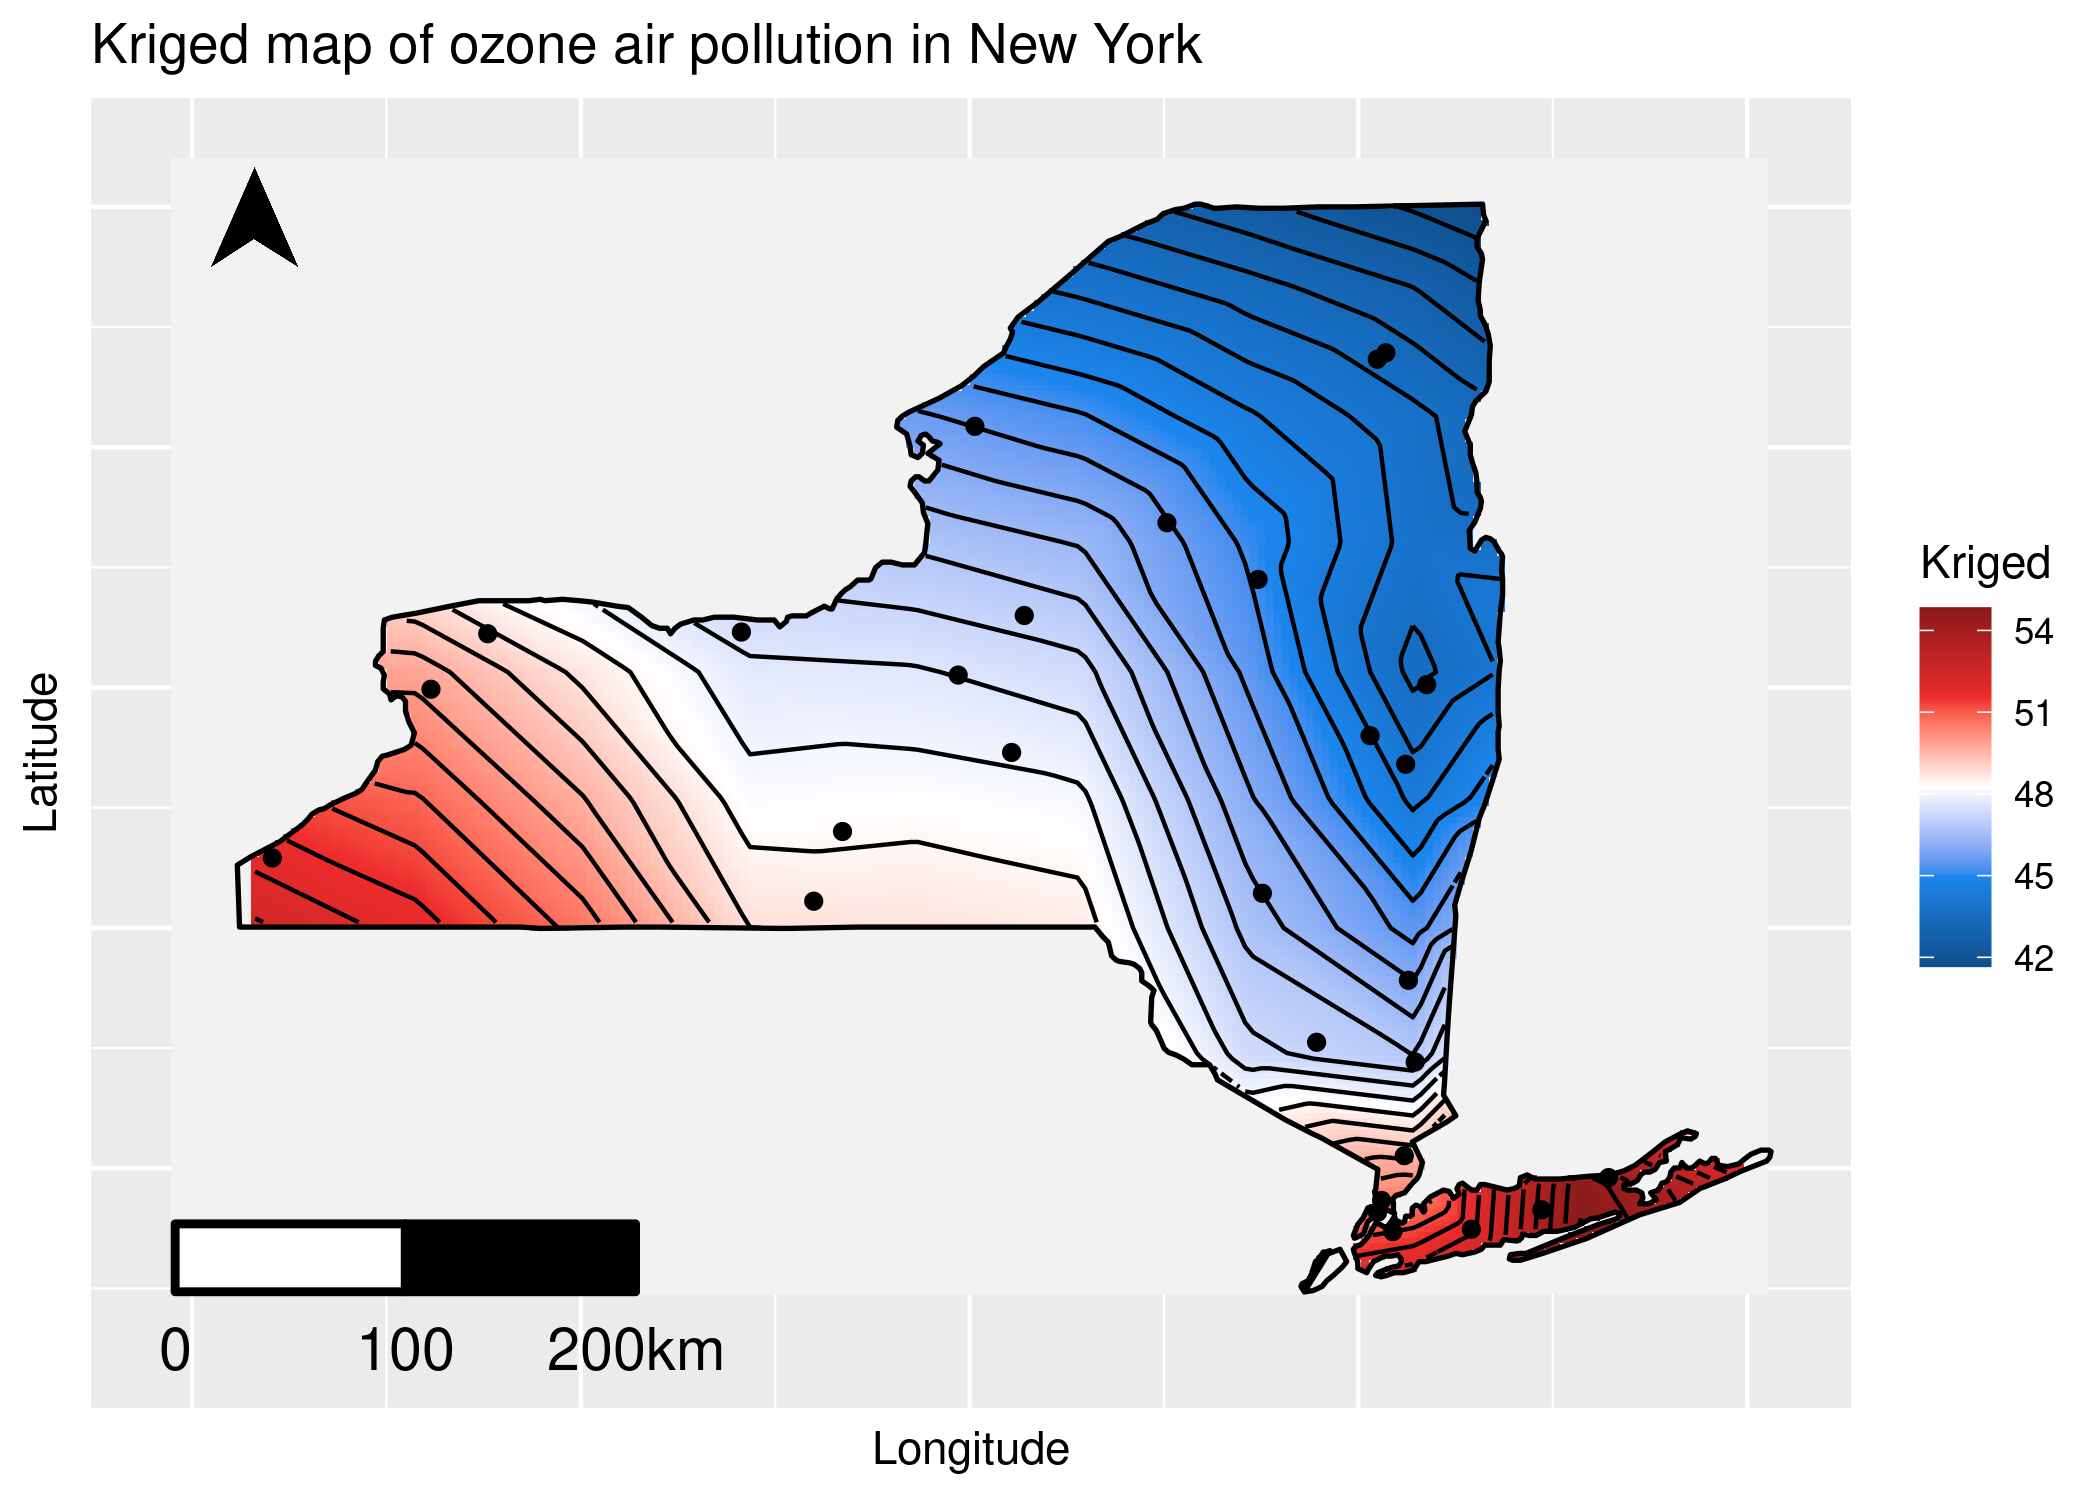
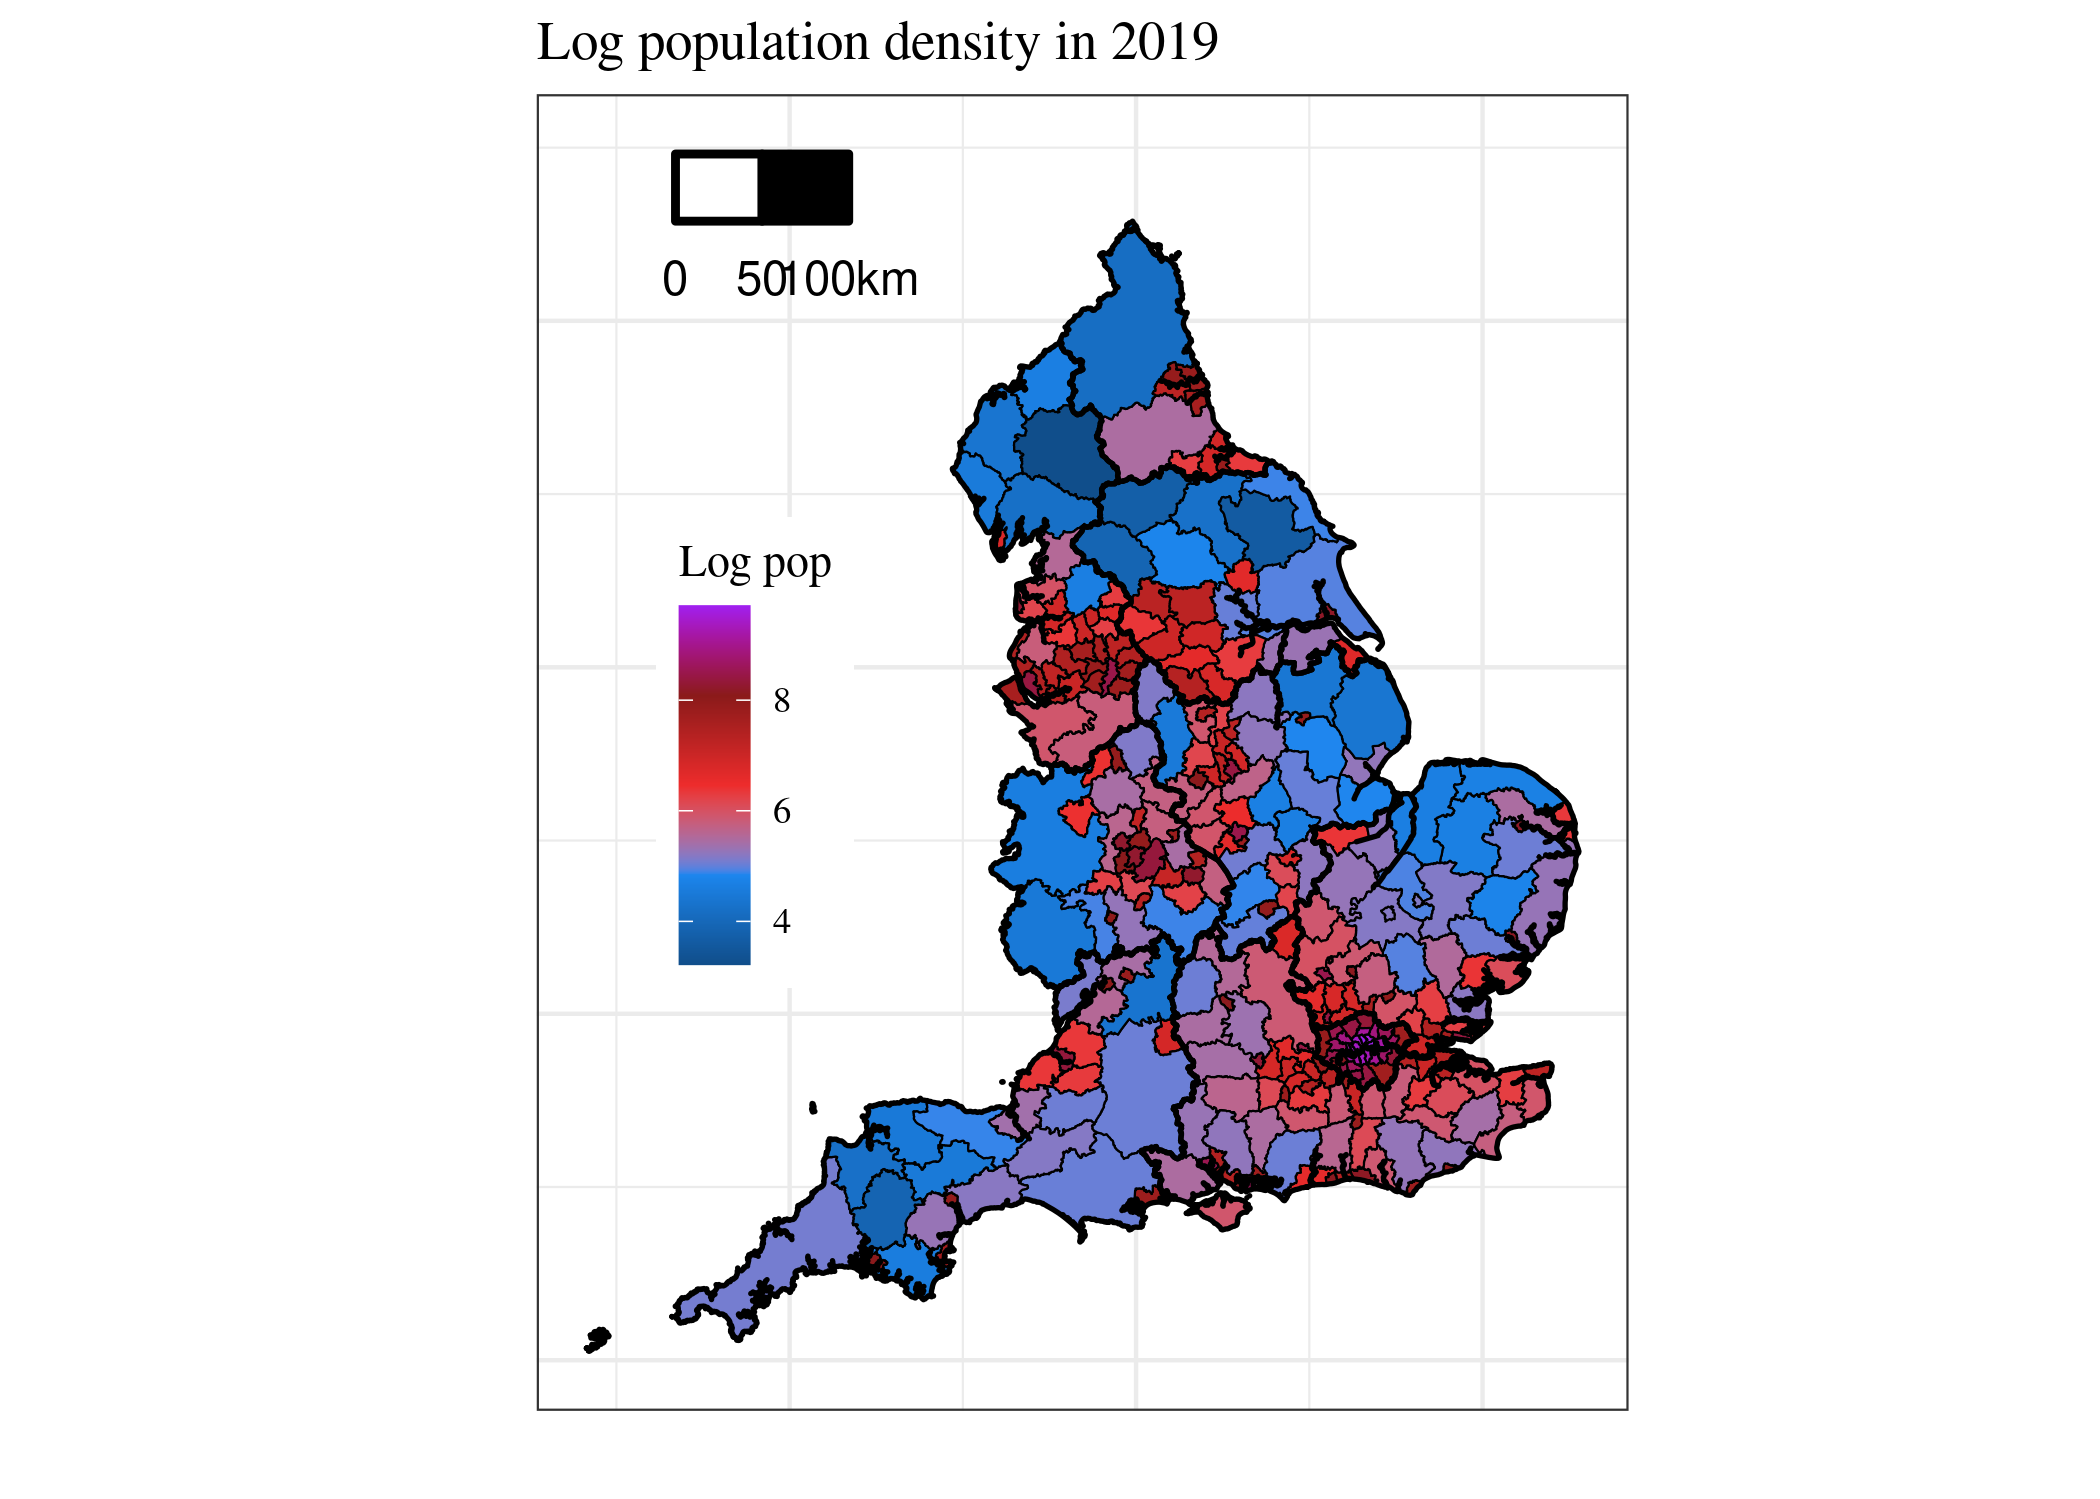
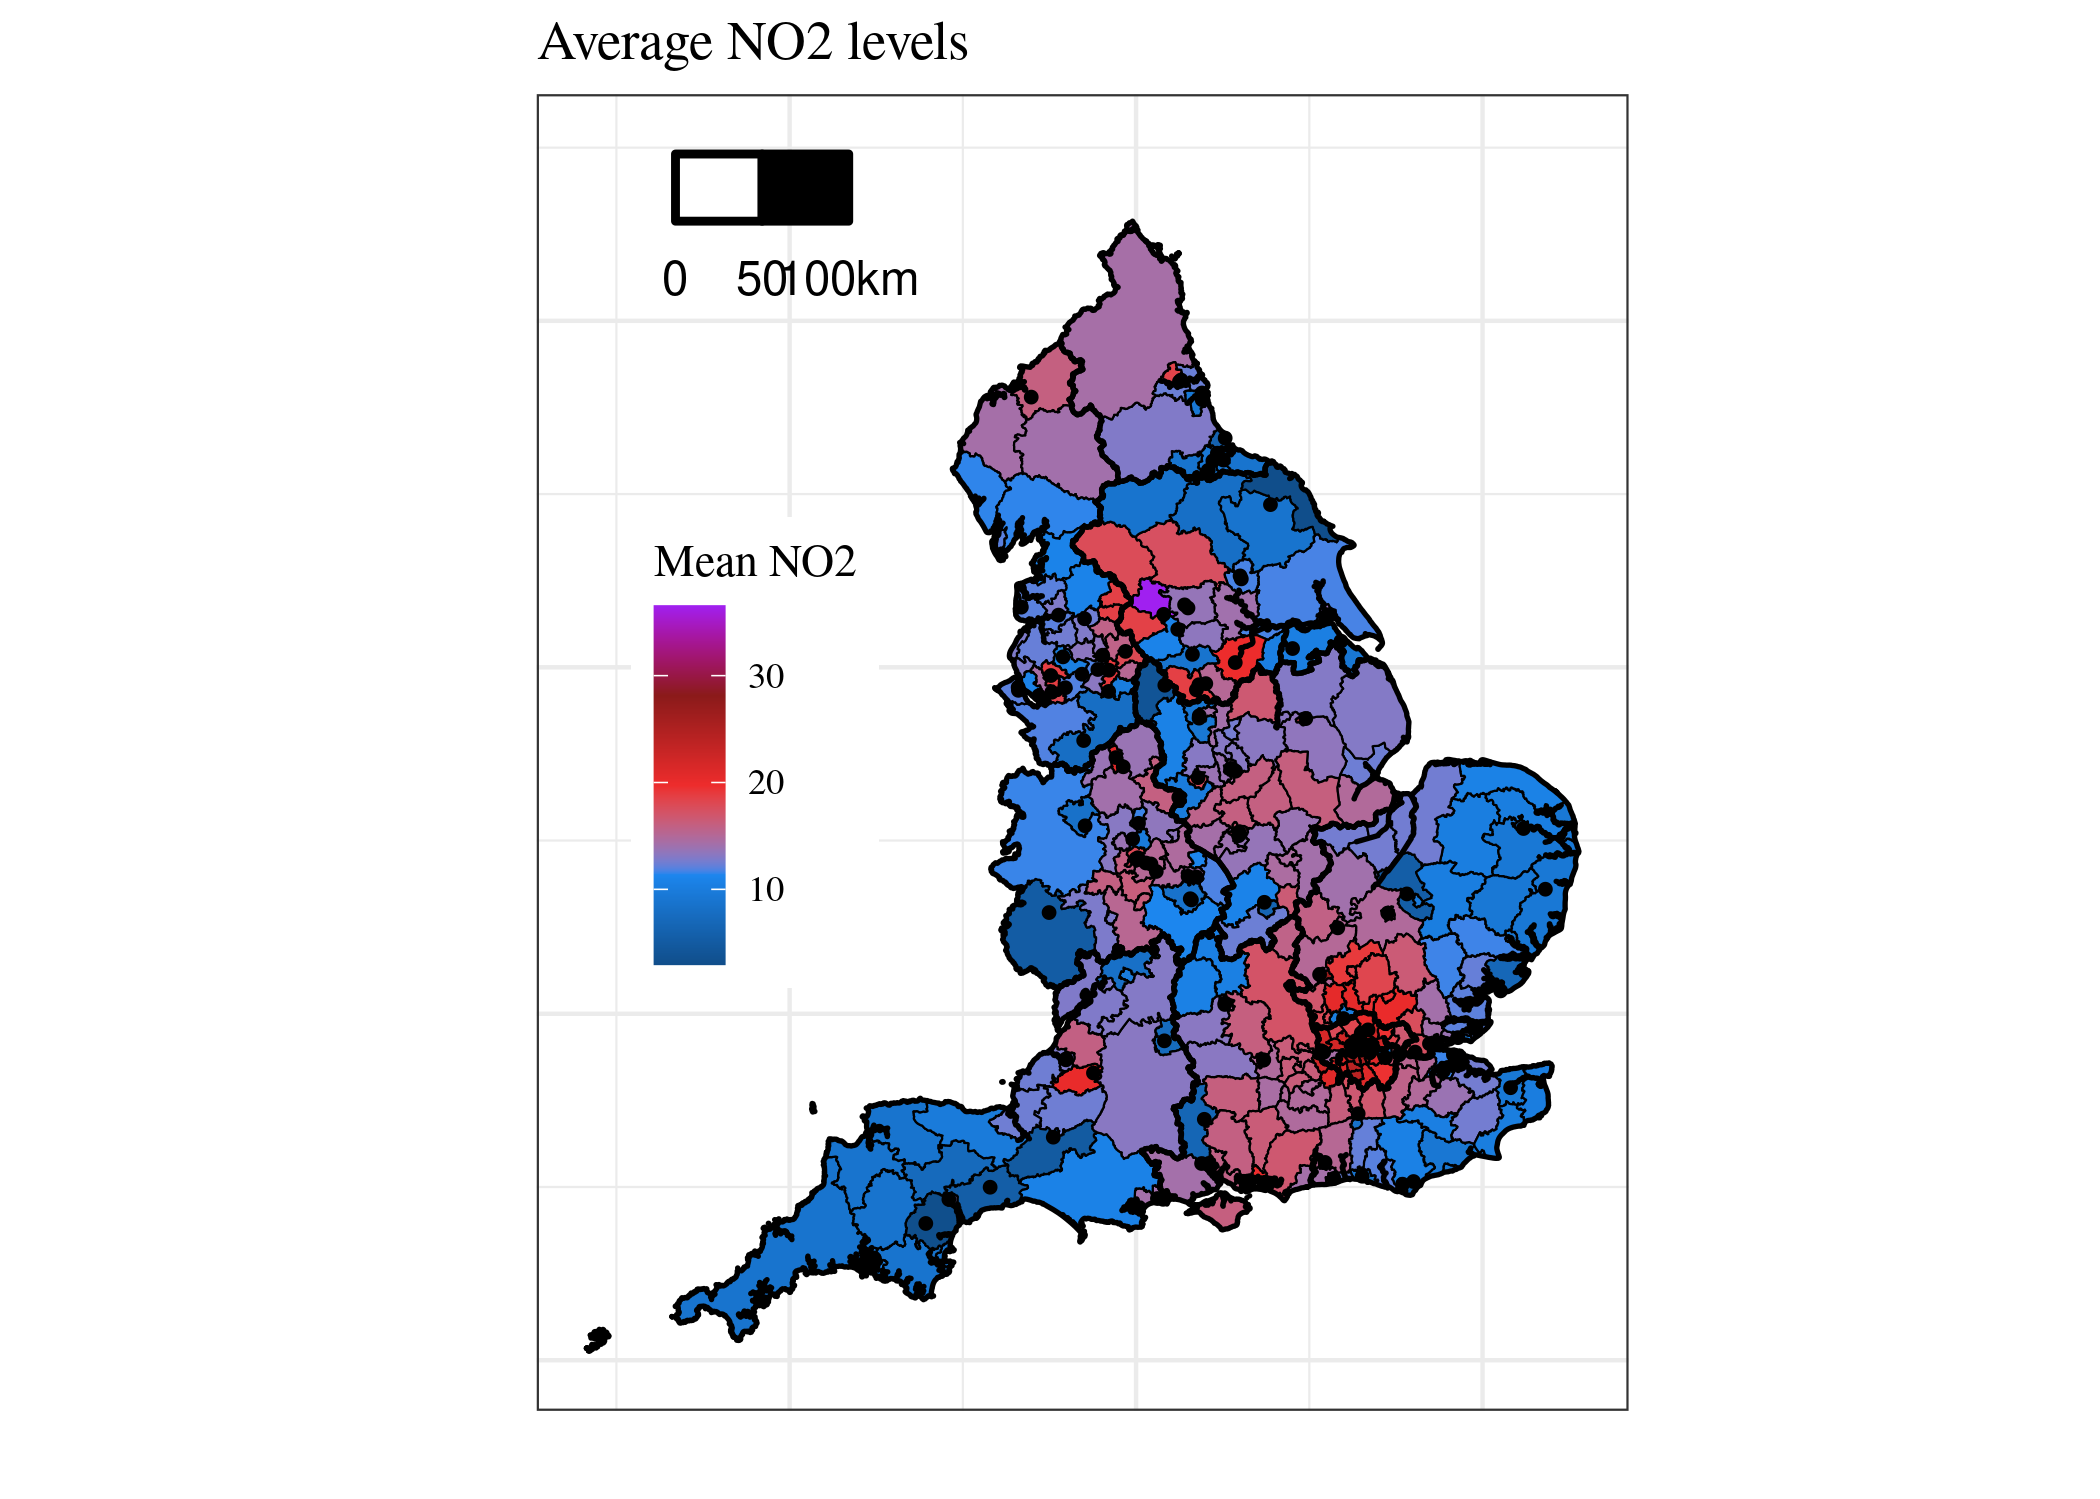
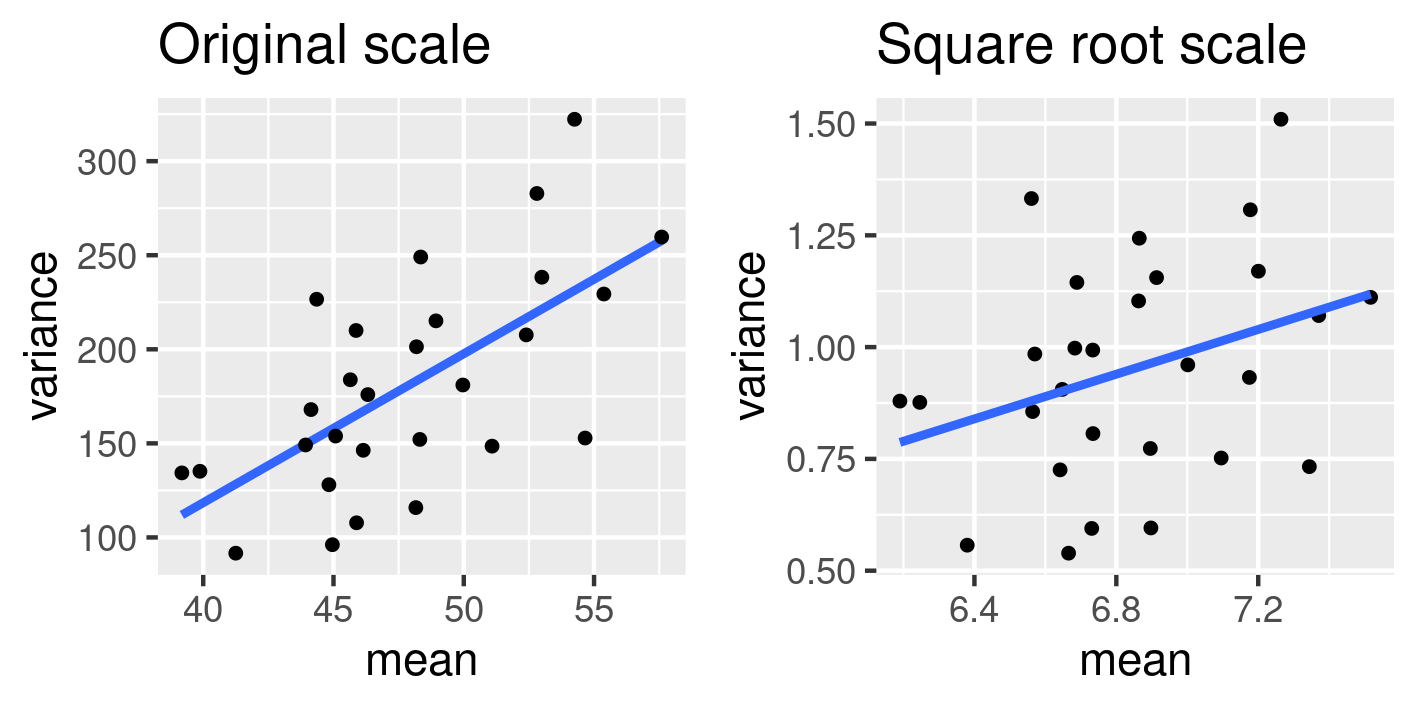
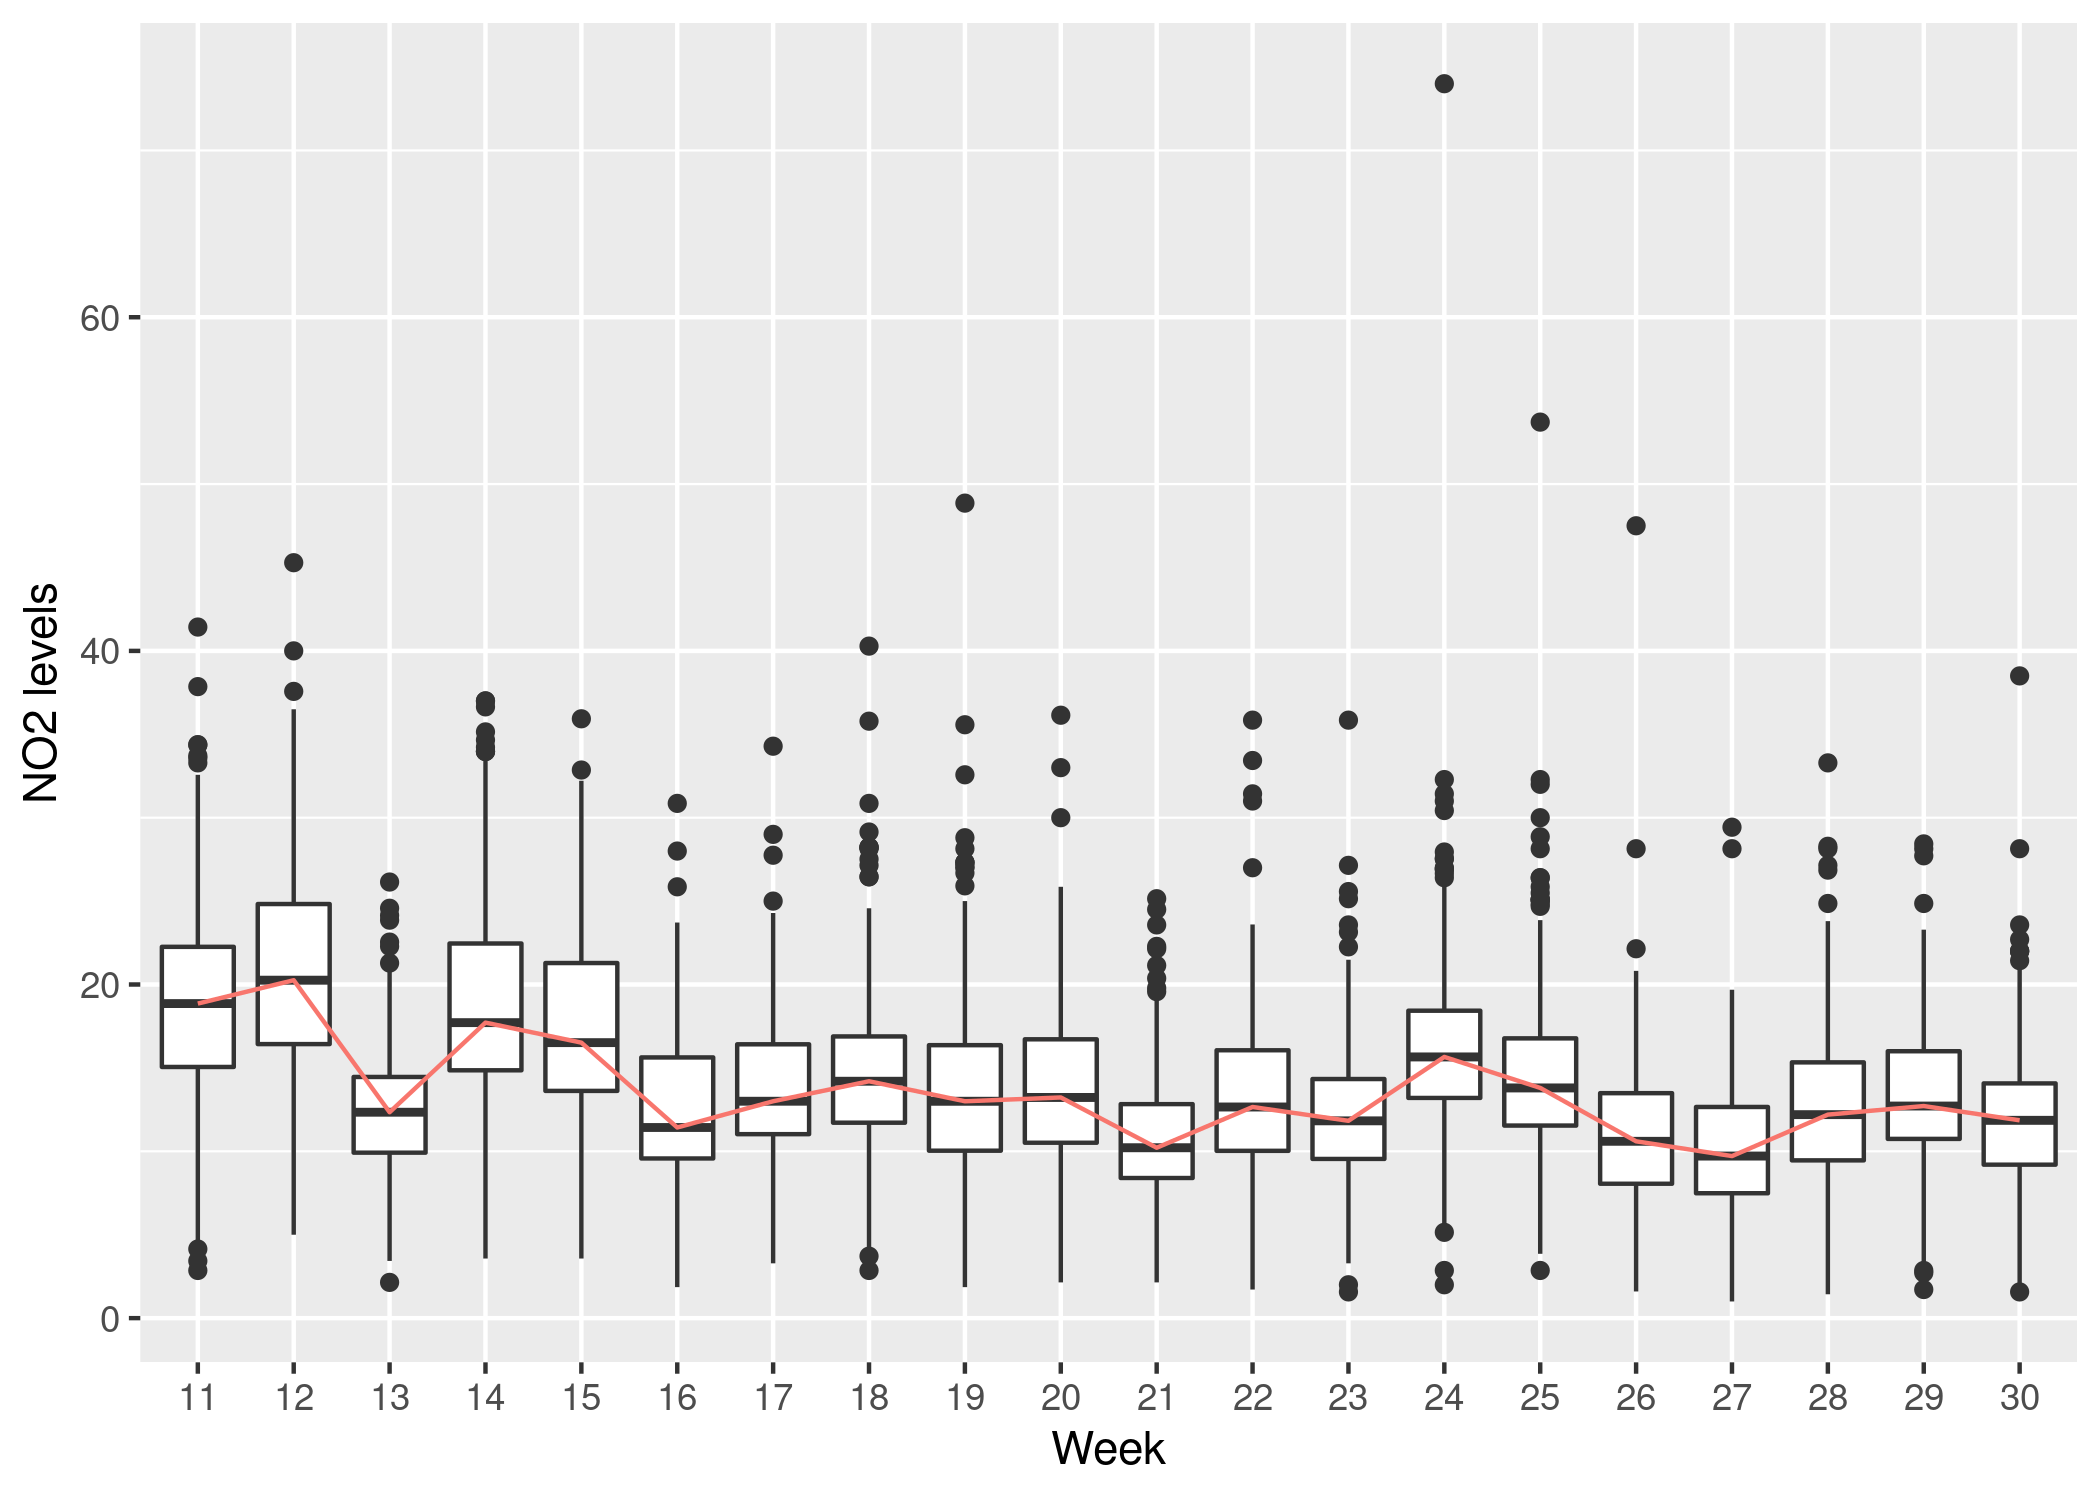
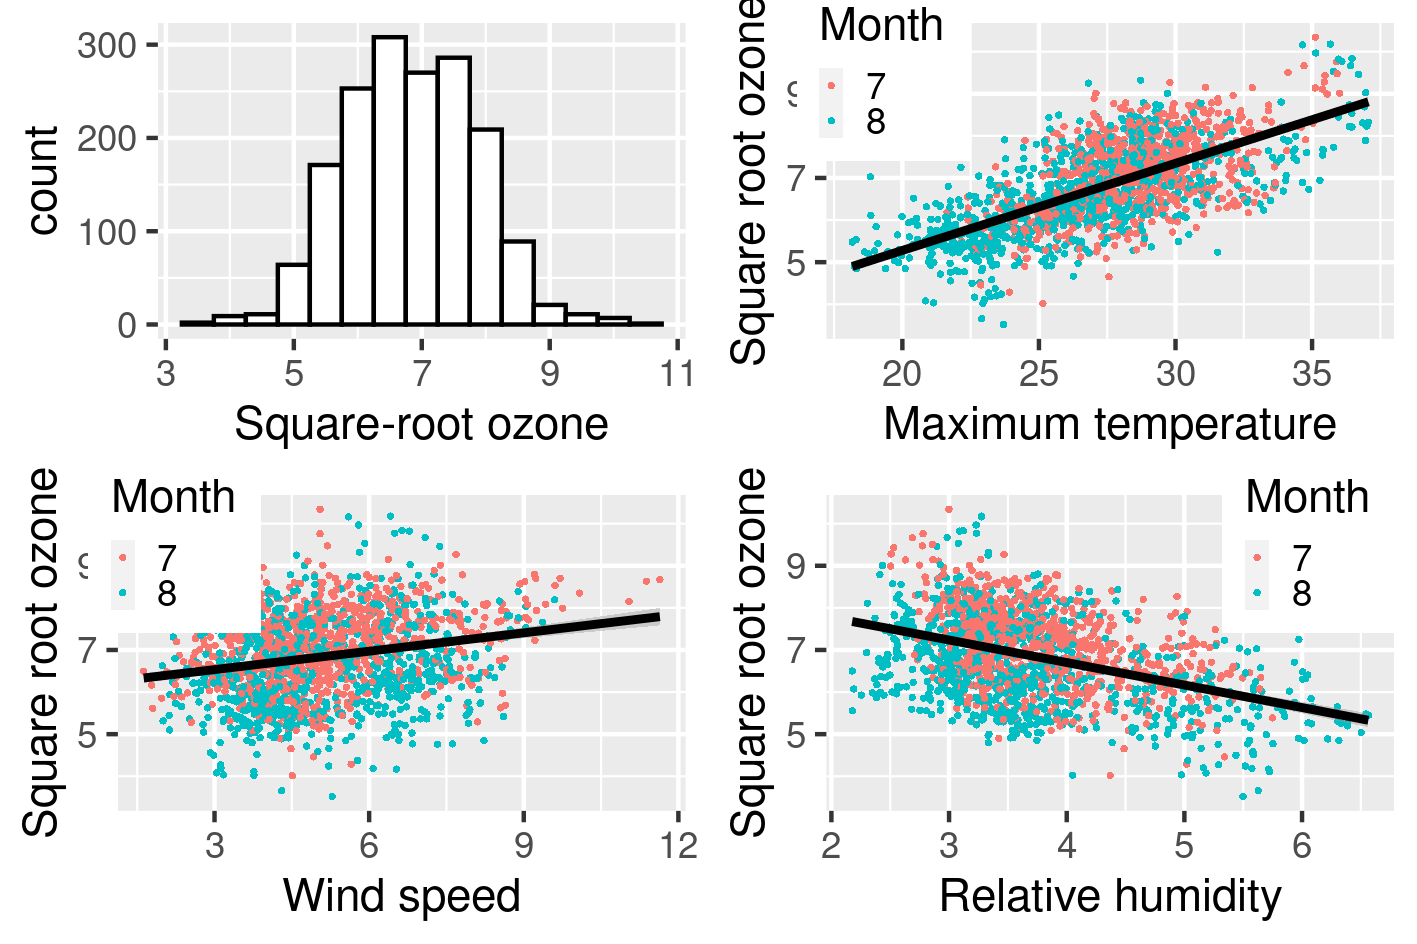
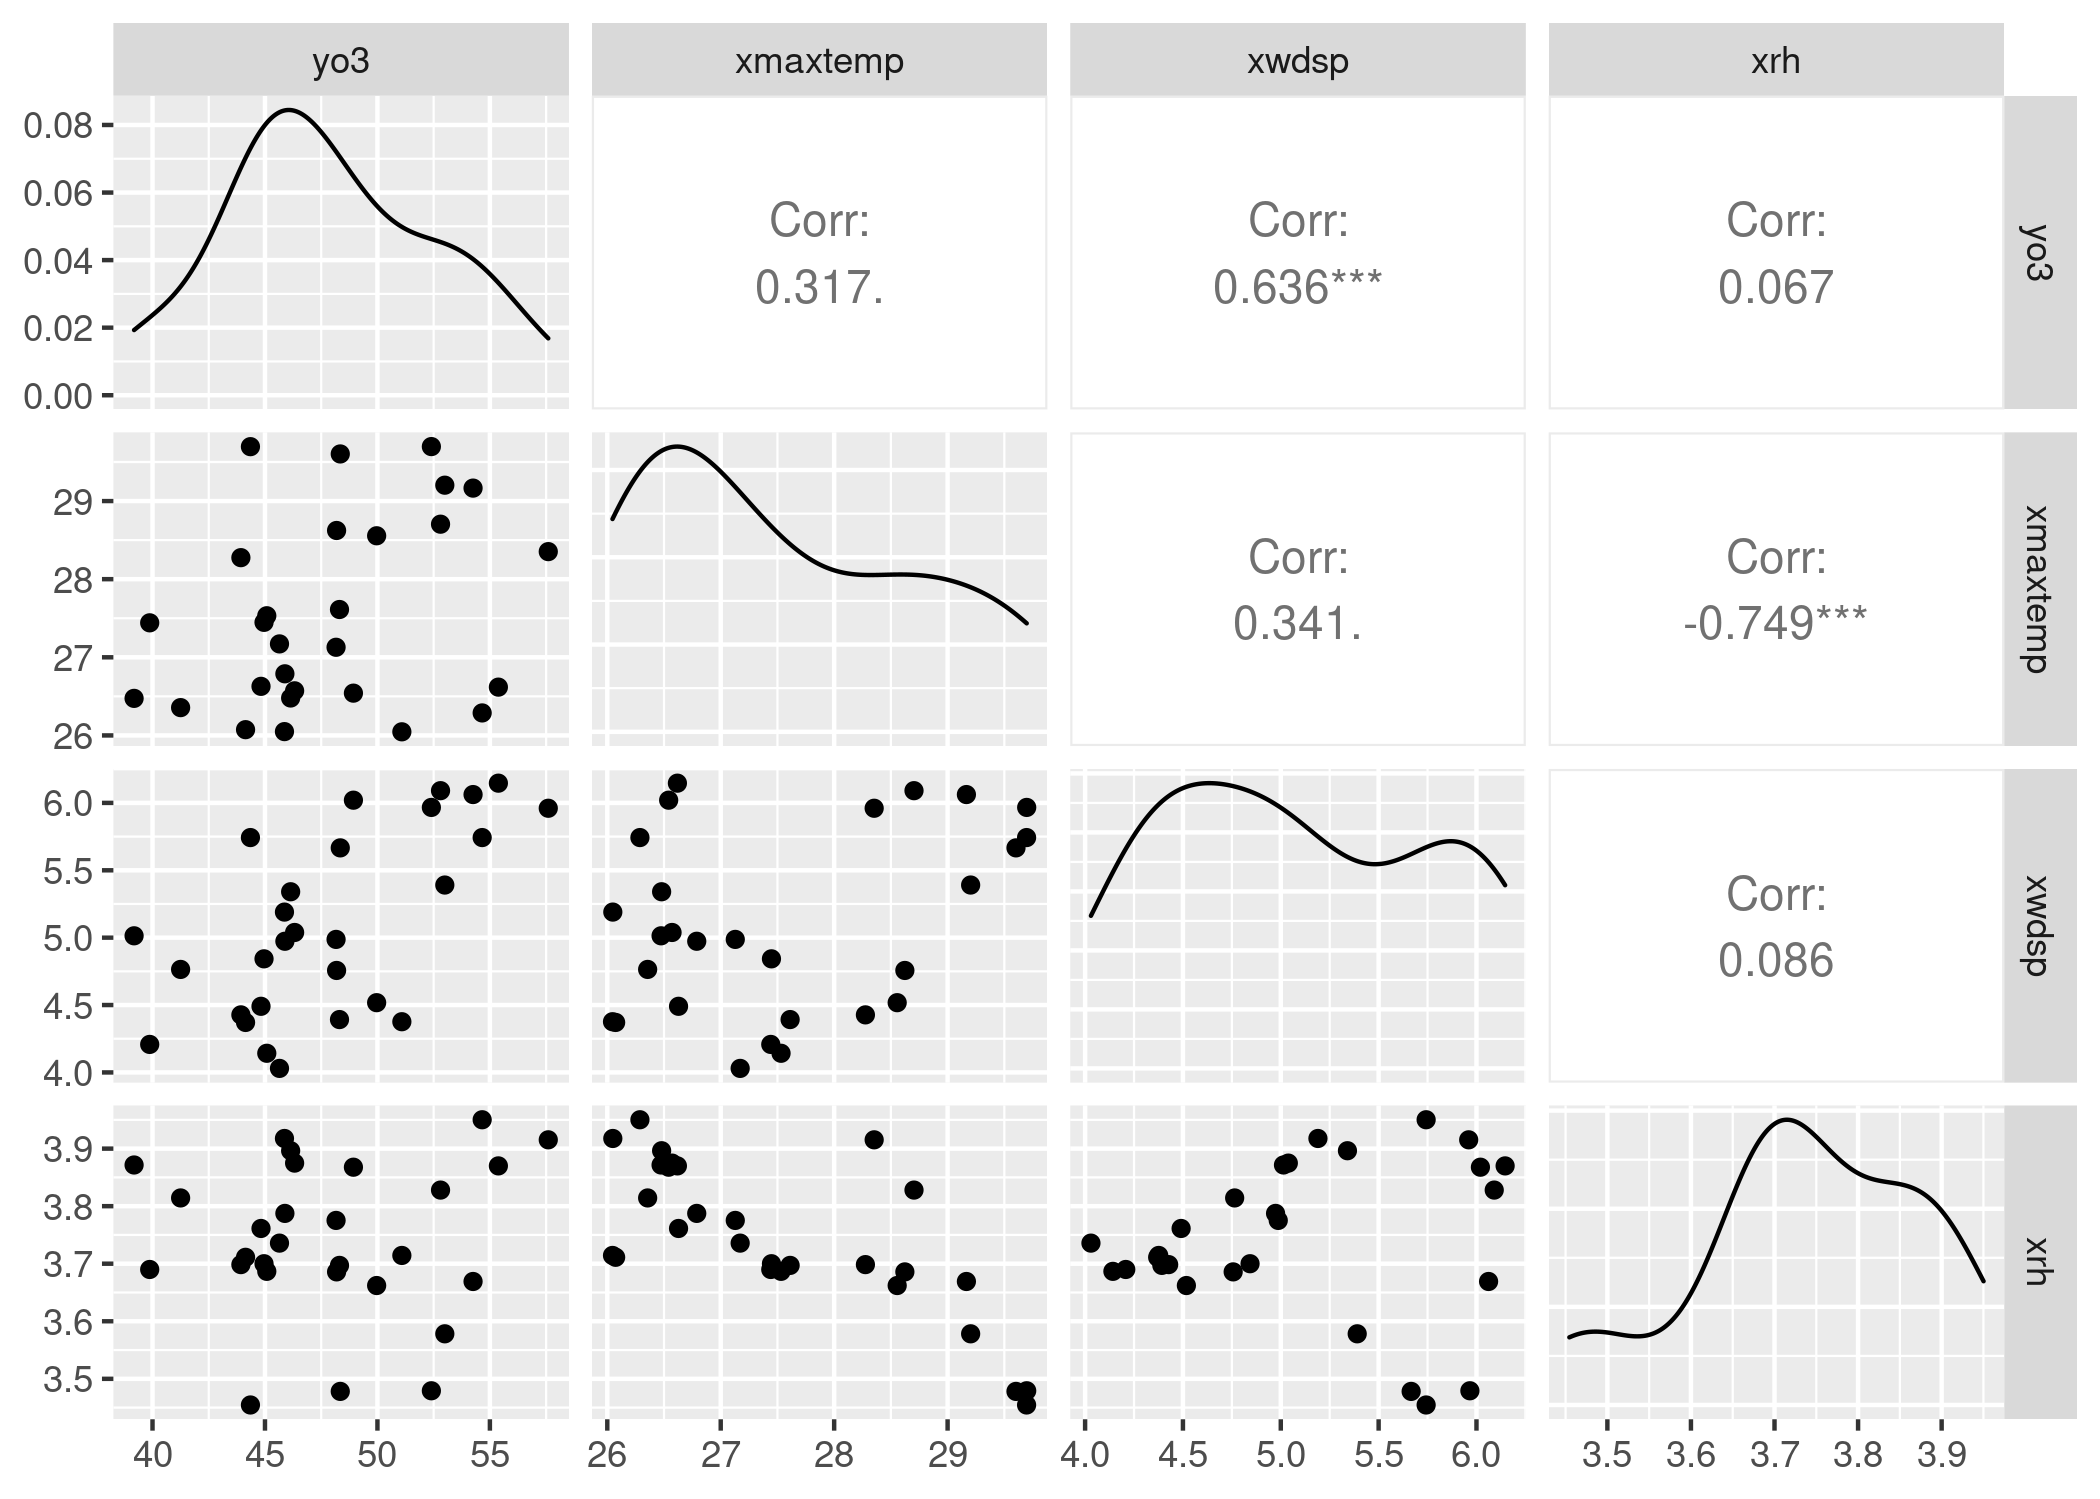
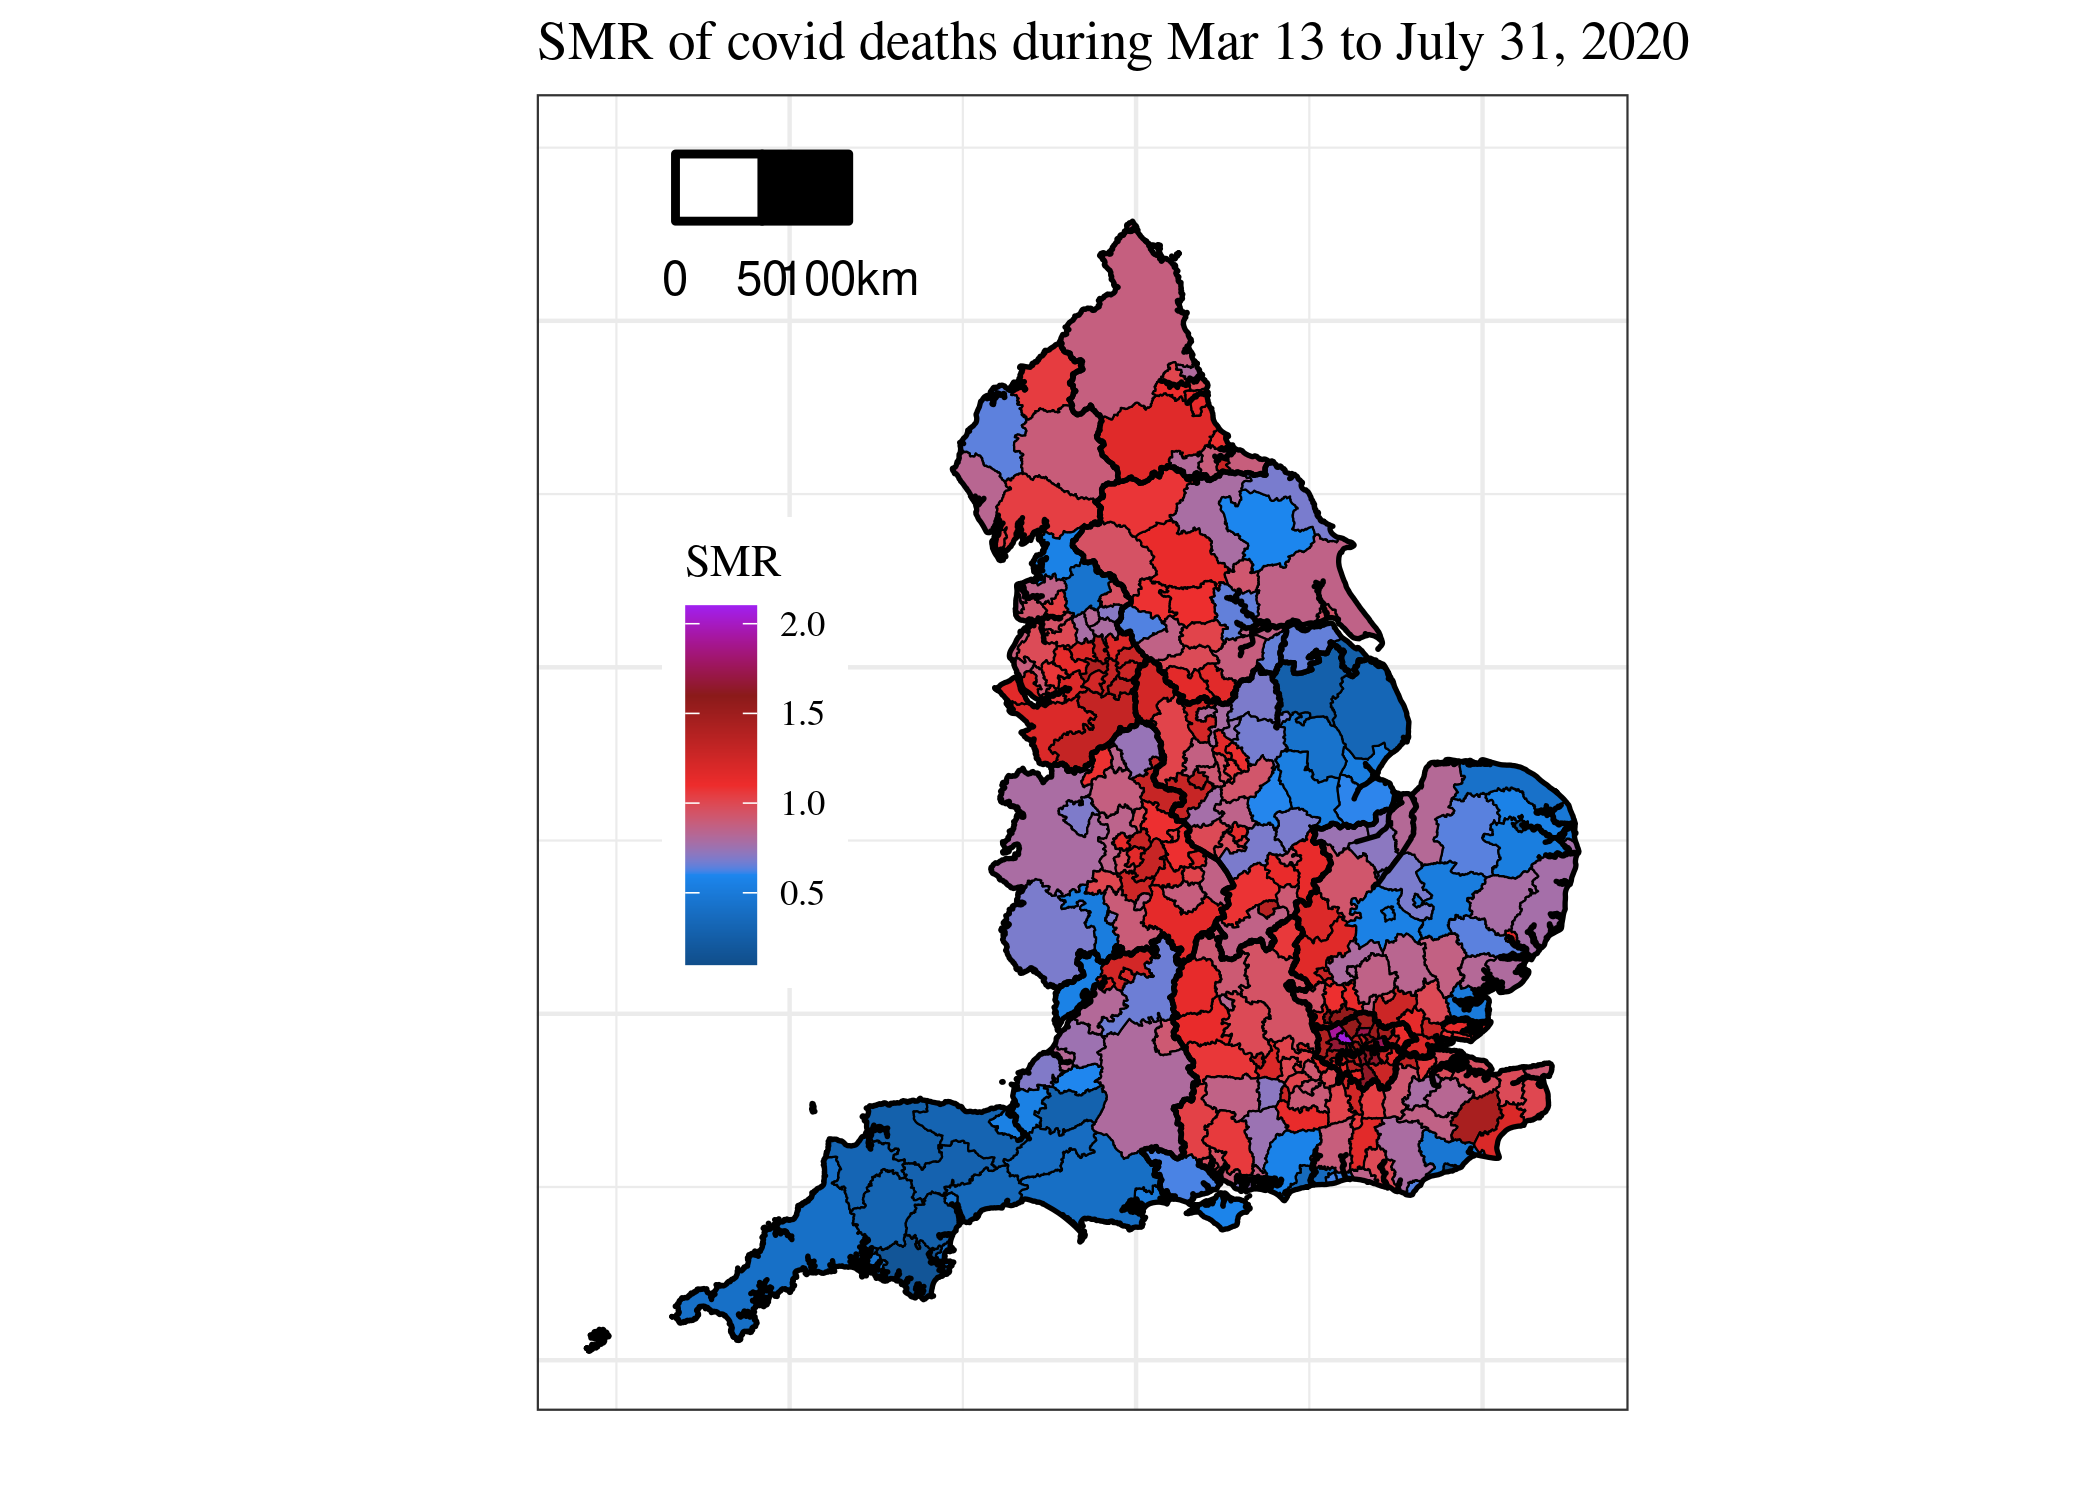
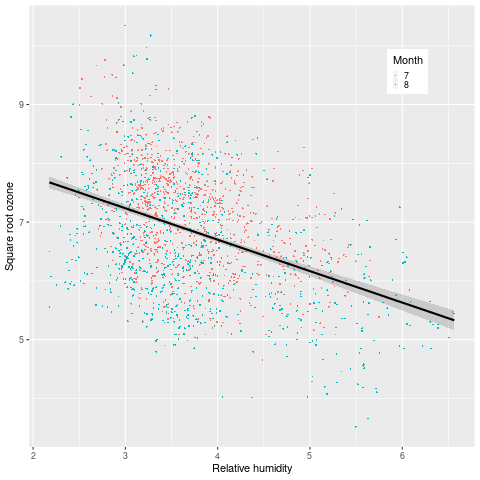
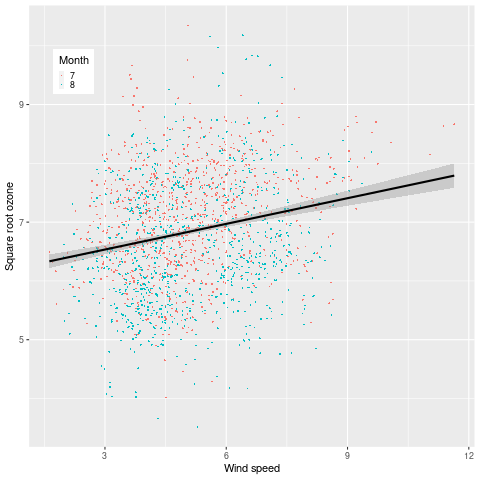
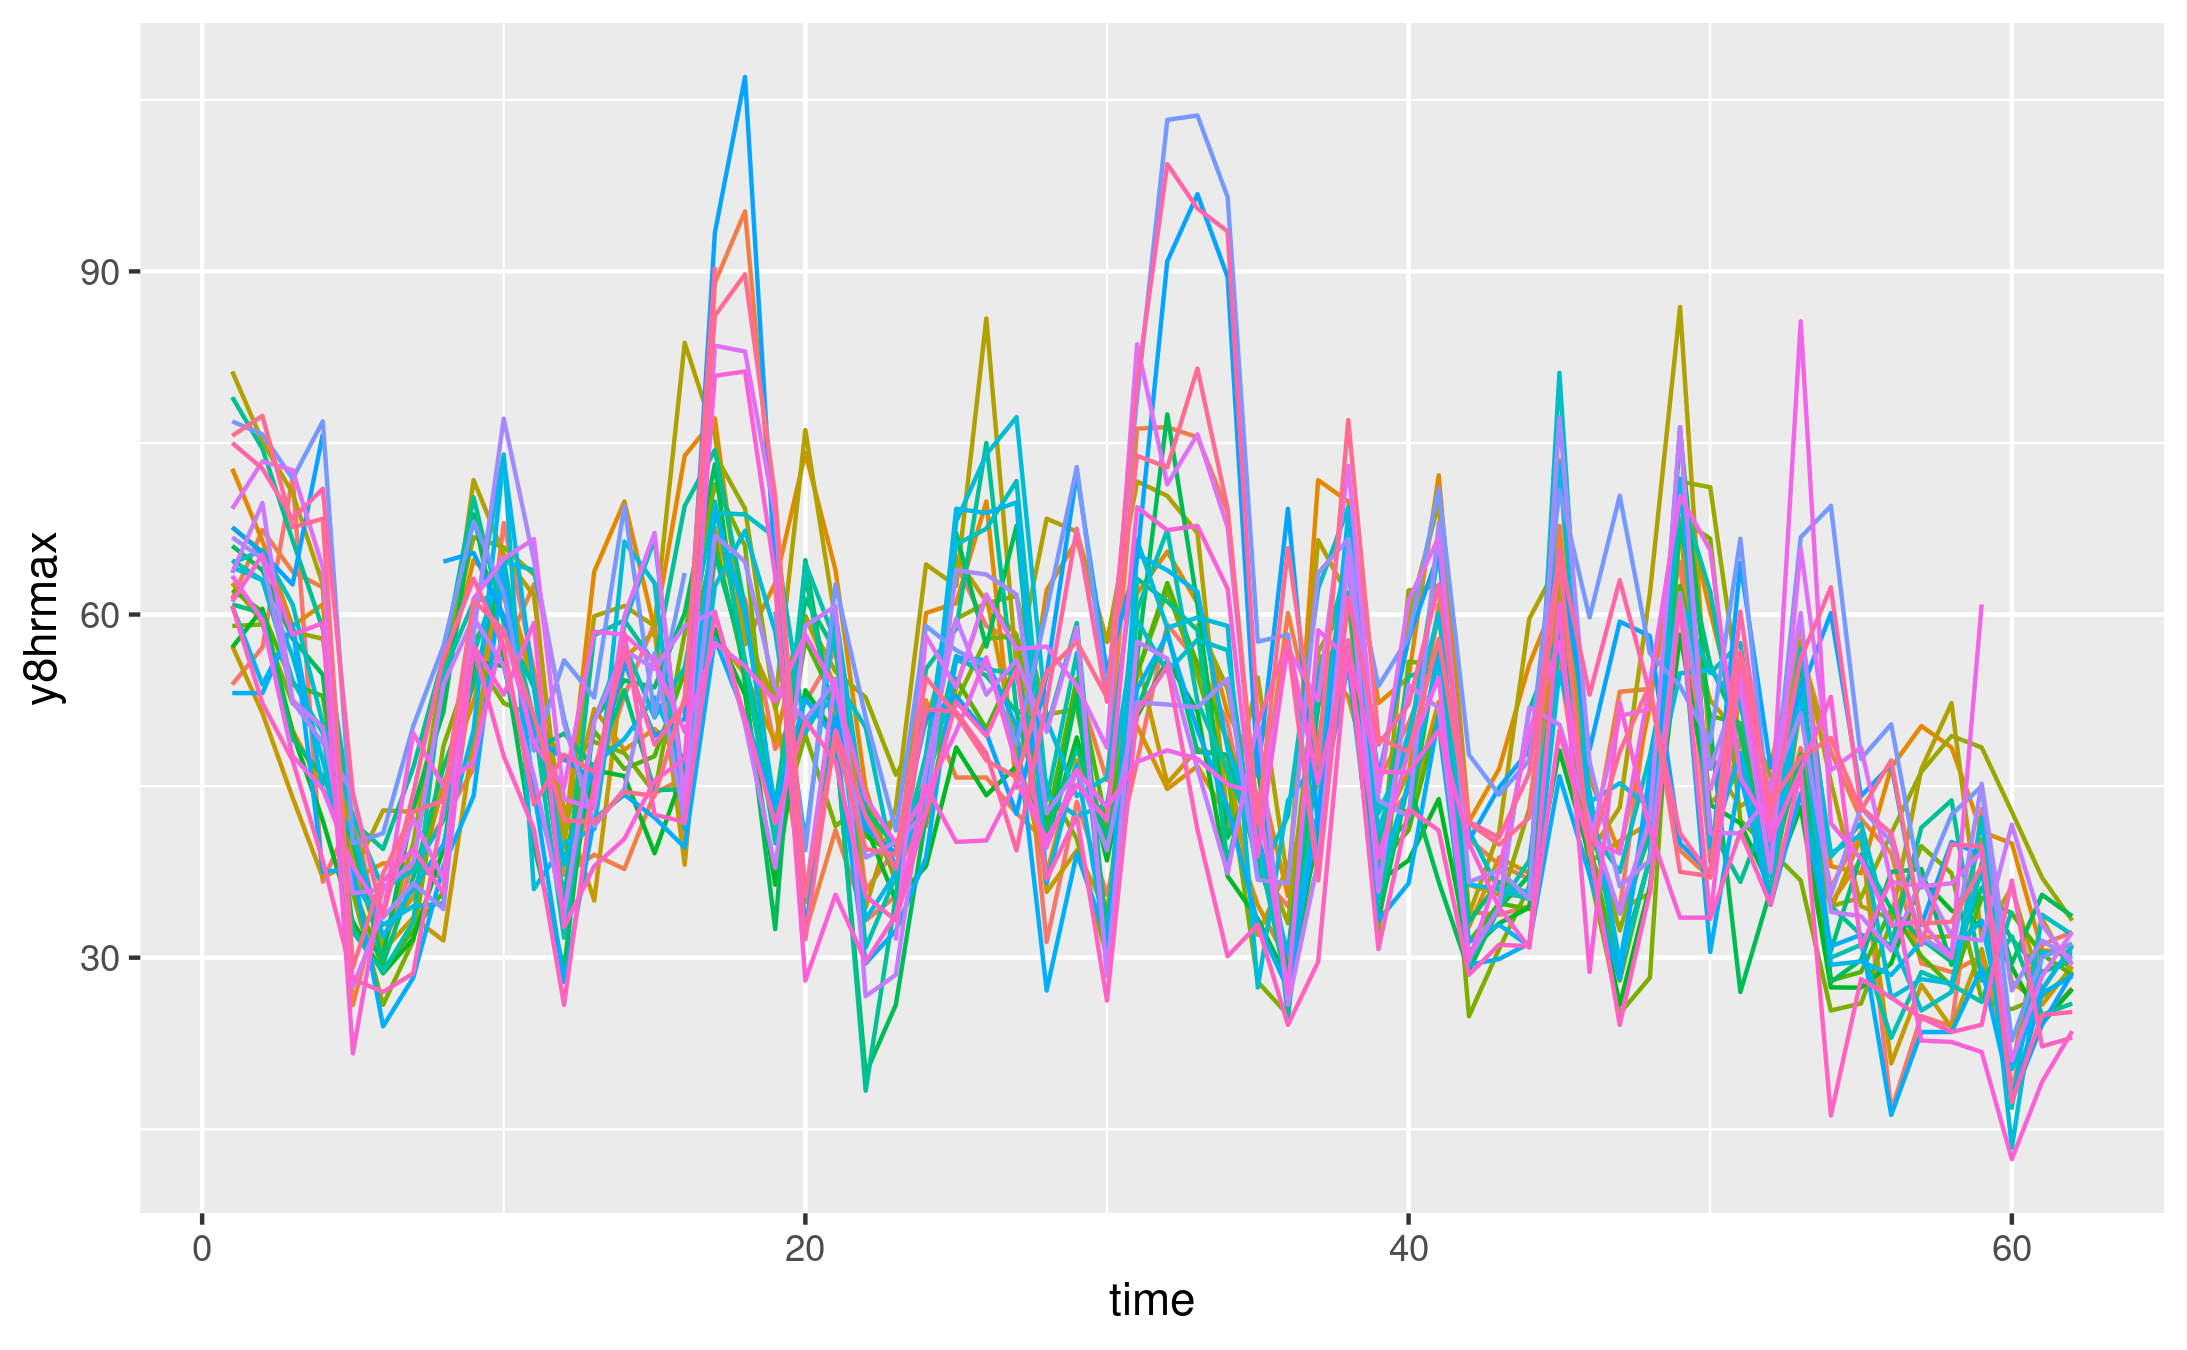
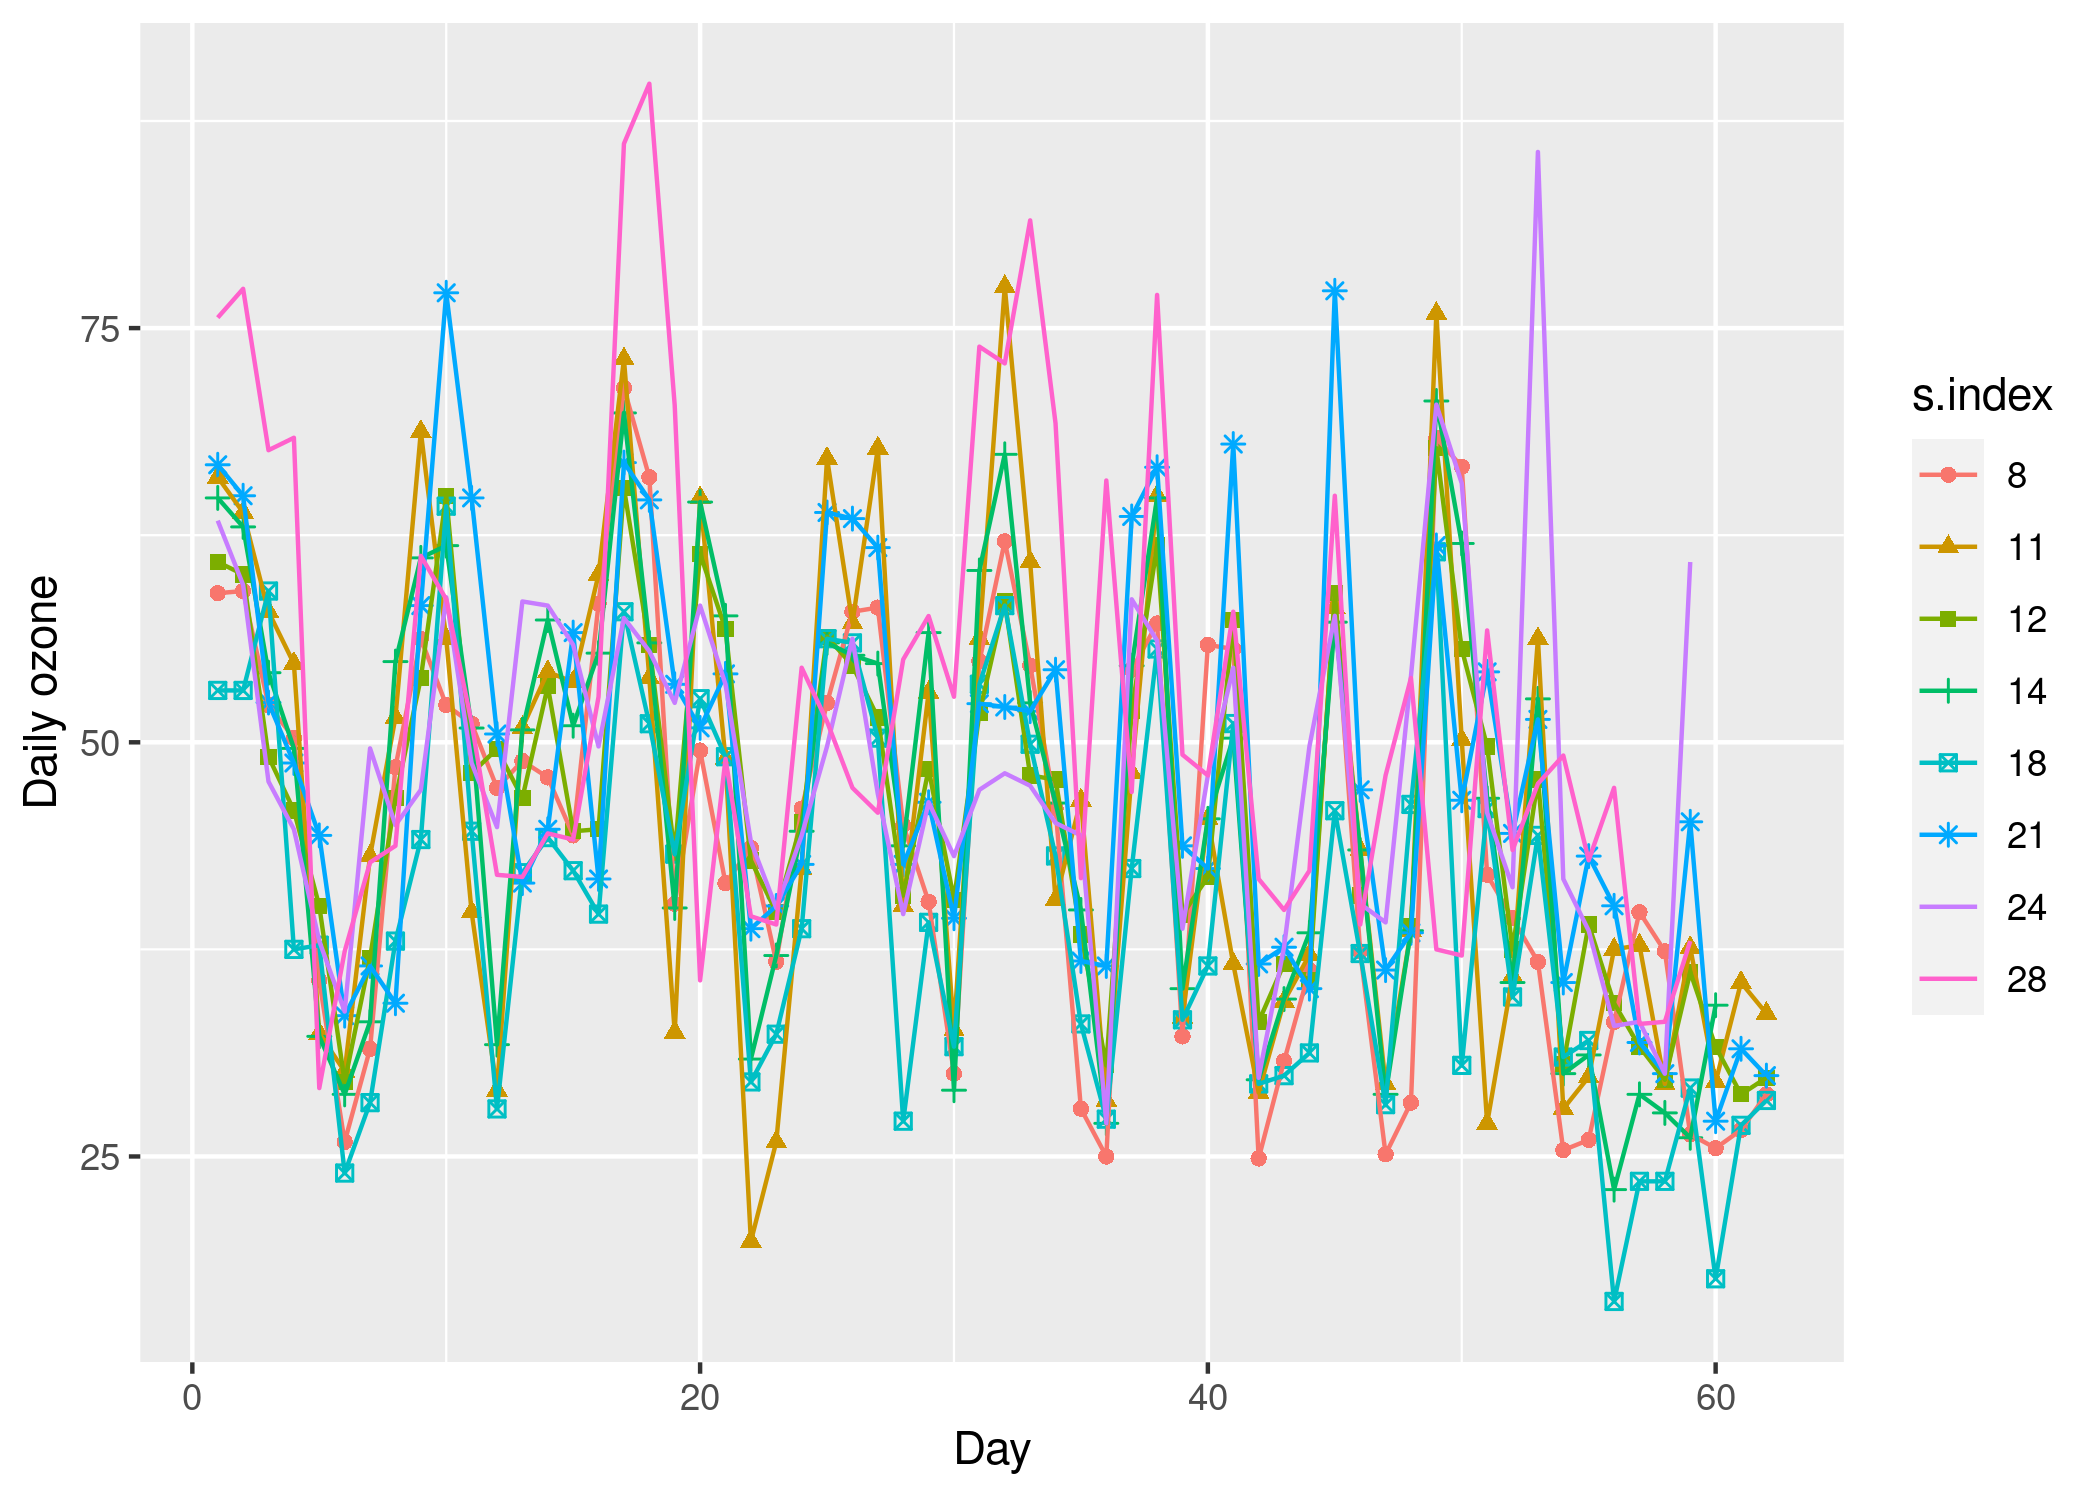
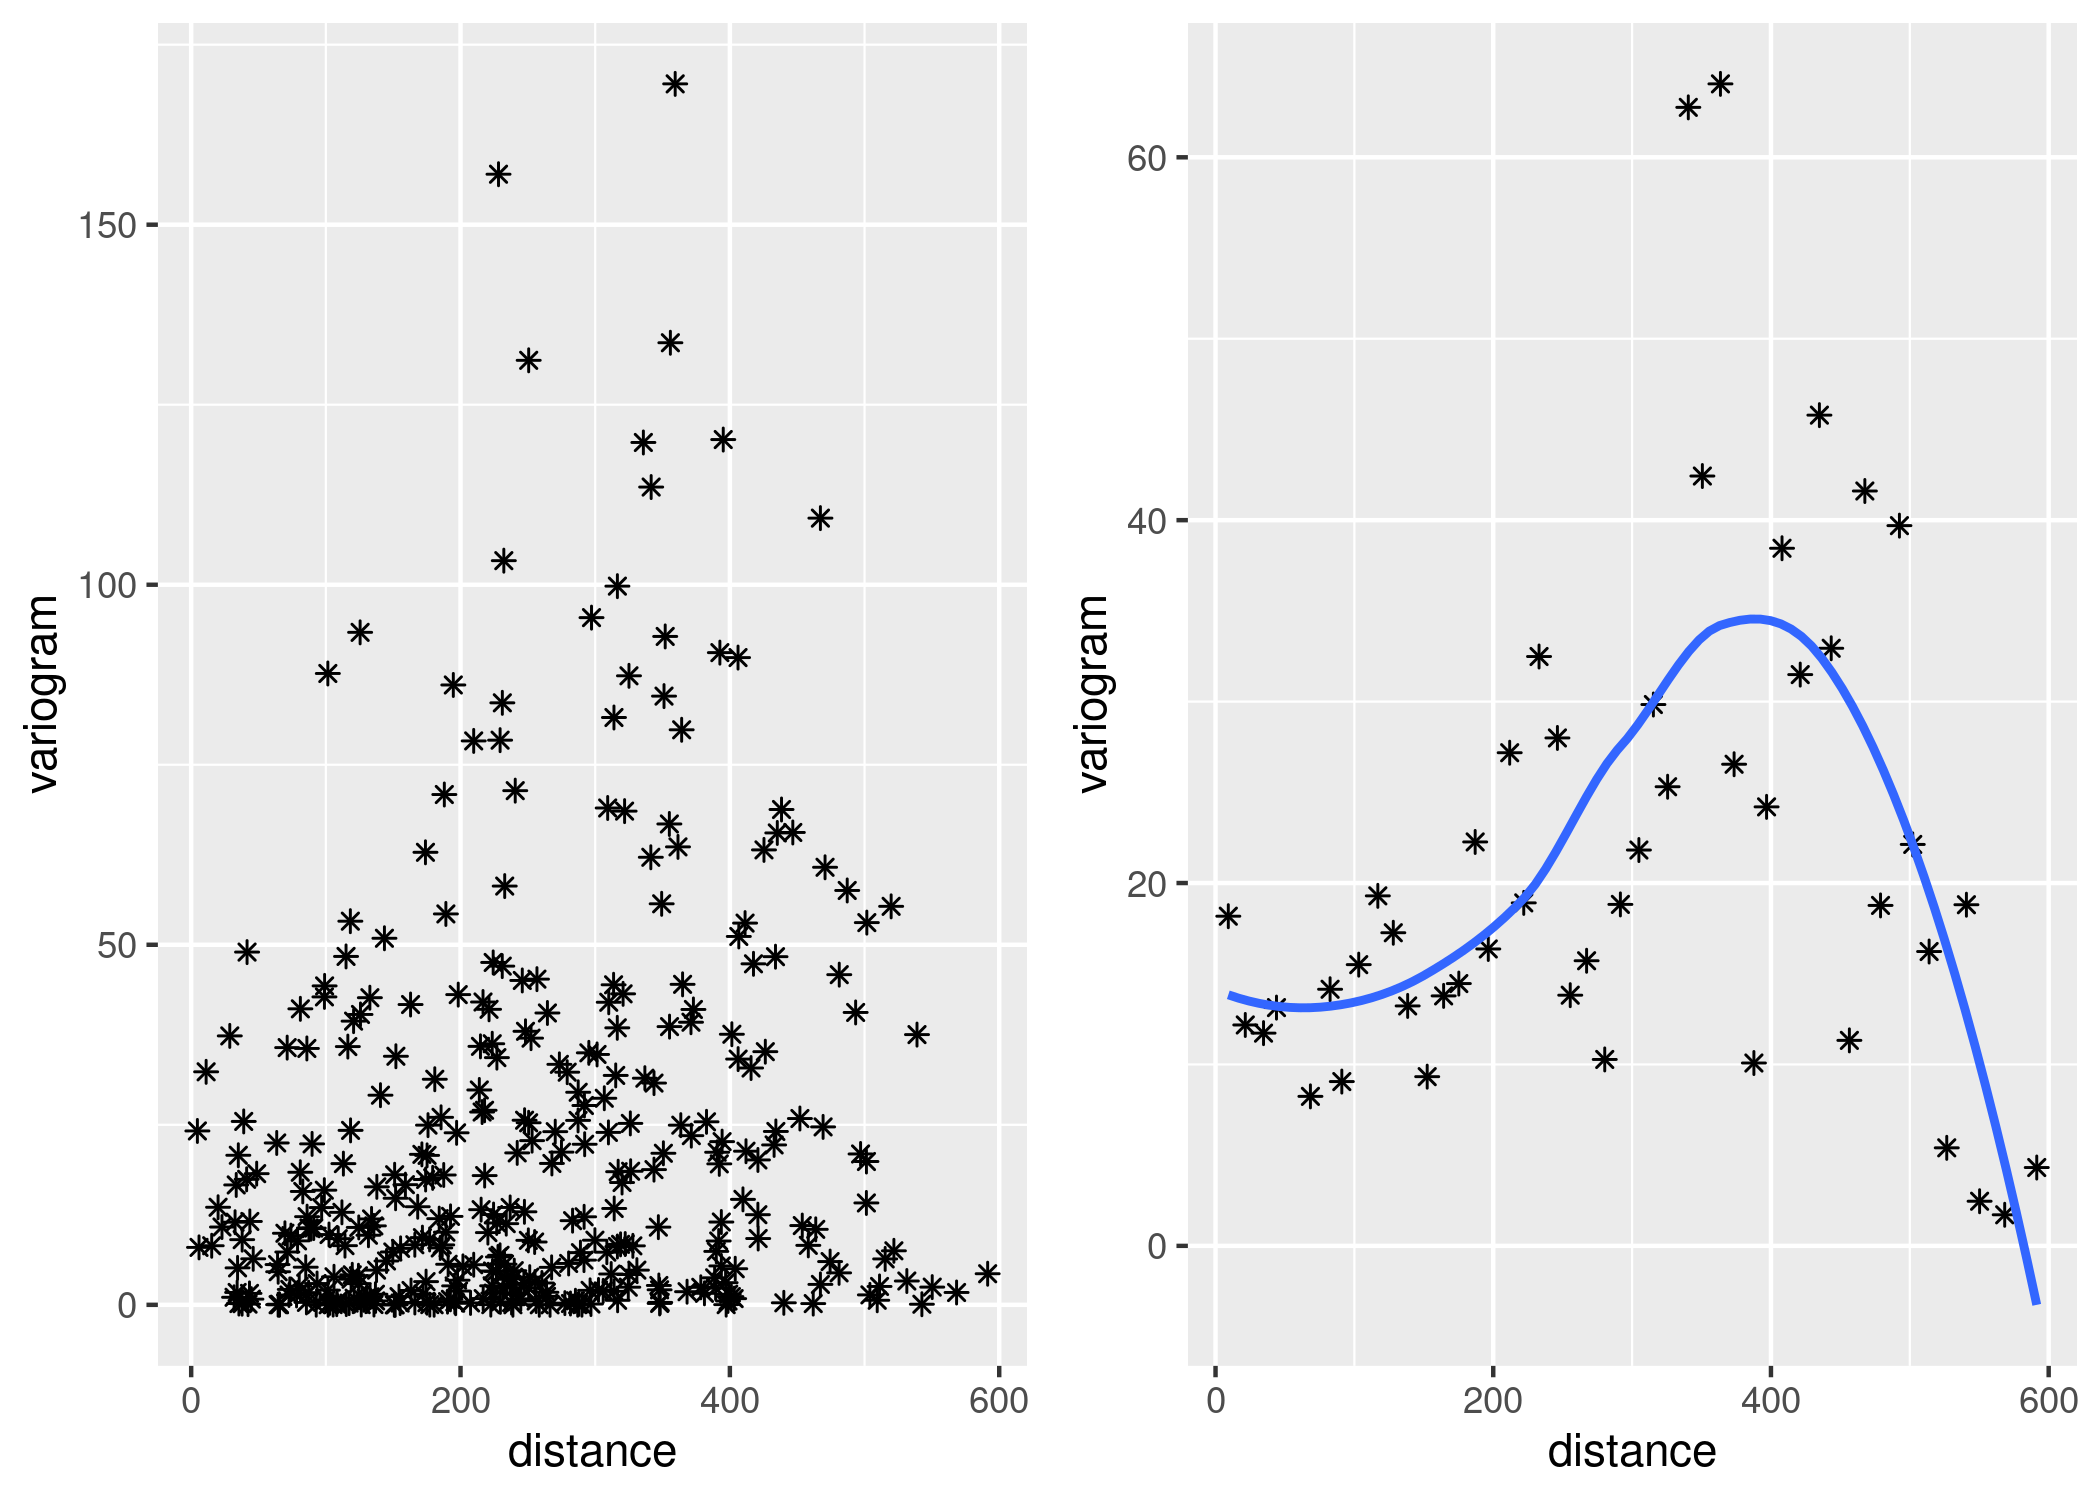
This chapter emphasizes the need to carry out Exploratory Data Analysis (EDA) before embarking on any modeling endeavor. EDA techniques introduced include non-spatial techniques such as histogram, pairwise scatter plots; spatial methods such as variogram and Kriging; and temporal exploration such as time series plots. In particular, the chapter explores the following four data sets which are provided in the bmstdr package. nyspatial : point referenced spatial air pollution data from New York, nysptime: point referenced spatio-temporal air pollution data from New York, engtotals: areal unit data on Covid-19 mortality in England, engdeaths: areal unit weekly temporal data on Covid-19 mortality in England, Familiarity of these data sets is crucial for understanding the modeling performed in the later chapters.
R code for reproducing the figures in Chapter 3.
